


Evaluating Pedestrian Safety Countermeasures |
|---|
 Topics: Federal Highway Administration
|
Tamara Redmon
Public Roads
March/April 2011
Researchers in Las Vegas, Miami, and San Francisco studied the effectiveness of tailored approaches to reducing pedestrian crashes.
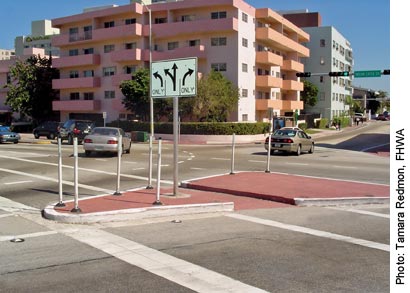 | At this test site in Miami, FL, the intersection includes a pedestrian refuge island, but the continuous right turn lane in the foreground can prove hazardous to pedestrians. Shown here is the intersection prior to the treatment, which involved adding a sign directing turning traffic to yield to pedestrians. |
Pedestrians hit in roadway crashes account for nearly 12 percent of all traffic fatalities and 59,000 injuries each year. Because crashes involving pedestrians tend to be sporadic events that do not occur at the exact same location, a one-size-fits-all approach to mitigating pedestrian safety problems is unrealistic. To help shed light on which countermeasures will be most effective at specific types of locations, the Federal Highway Administration (FHWA) initiated pilot projects in Las Vegas, NV, Miami, FL, and San Francisco, CA. The study, known as the Pedestrian Safety Countermeasure Deployment Project, looked at the effectiveness of various safety engineering and intelligent transportation systems (ITS)-based countermeasures installed at target intersections in those cities.
In 2002, FHWA selected the three cities through a competitive grant program. The cities chosen were aware of their pedestrian safety issues and recognized the importance of making data-driven decisions. Countermeasures deployed and evaluated included automated video detection of pedestrians, flashing beacons, instreet pedestrian signs, and median refuge islands. The main goal was to demonstrate how a city can improve safety by performing a detailed analysis of its pedestrian crash problem, identifying and evaluating high-crash locations, observing factors such as driver and pedestrian behavior, and deploying various countermeasures tailored to the site.
Over the 6-year study, with a budget of approximately $1 million, each city identified problem locations, selected and installed countermeasures, and evaluated the impact on pedestrian safety. After the completion of each city’s self-evaluation (between 2007 and 2008), FHWA conducted an independent assessment to compare the effectiveness of the deployments.
“People of all ages and abilities should be able to walk in and around their communities safely, which is why making our streets safer for pedestrians is a priority for FHWA,” says FHWA Associate Administrator for Safety Joseph S. Toole. “The lessons learned from the pilot cities participating in this project will help other cities across the country prevent pedestrian injuries and fatalities.”
A Two-Phased Approach
The study took place in two phases: (1) problem identification and countermeasure selection and (2) countermeasure implementation and evaluation. During phase one, a team of researchers in each city documented pedestrian fatal and nonfatal crashes by reviewing police reports to identify high-crash locations where the countermeasures could be installed. The teams also used the data to determine which countermeasures to install. For example, at a location in Las Vegas where pedestrian crashes were occurring midblock, the city decided to install a median refuge island to give pedestrians a safe place to stand while waiting to cross the second half of the road.
Researchers collected data on all fatal and nonfatal crashes involving pedestrians and then mapped the data using geographic information system (GIS) technology. This zone analysis method, developed by the National Highway Traffic Safety Administration (NHTSA), helps focus resources on locations with high potential for collision and injury reduction. Ultimately, the researchers chose locations with high numbers of pedestrian crashes for the countermeasure installations.
During phase two, the teams implemented the countermeasures at the specific sites identified during the first phase. Phase two took place between 2004 and 2008. Las Vegas studied 15 countermeasures, while Miami studied 16 and San Francisco 13.
Countermeasures and Deployment Locations |
||||
| Countermeasure | Description | Las Vegas | Miami | San Francisco |
“Turning Traffic Yield to Pedestrians” signs |
Signs used to remind drivers making turns that they must yield to pedestrians in the crosswalks |
|
|
|
Instreet pedestrian crossing signs |
Flexible signs placed in the median or centerline |
|
|
|
Pedestrian zone signs |
Signs that alert drivers to watch for pedestrians |
|
|
|
“No Turn on Red” signs |
Static, static conditional, and electronic signs that prohibit right turns at red traffic signals |
|
|
|
Portable radar speed trailers |
Used to deter speeding, these devices can be installed along the side of the road -- typically in parking areas -- and display the speed of each approaching vehicle |
|
|
|
High-visibility crosswalk treatment |
Including ladder and diagonal markings, these crosswalks enhance the visibility of the crossing area to alert drivers to where pedestrians will be crossing the roadway |
|
|
|
Advance stop lines |
A line typically painted 4–10 feet (1.2–3 meters) ahead of a crosswalk to discourage motorists from stopping in the crosswalk and to improve visibility |
|
|
|
“Look” pavement stencils |
Thermoplastic stencils applied on pavement in crosswalks (within 4 feet, 1.2 meters, of curb) to encourage pedestrians to watch for vehicles |
|
|
|
Pedestrian countdown signals |
Signals that show the time remaining for the pedestrian crossing |
|
|
|
Call buttons that confirm the press |
Buttons that give feedback to pedestrians by lighting up or making a noise when activated |
|
|
|
Automated pedestrian detection |
Technology that detects pedestrian presence and does not require pedestrians to push a button to activate it |
|
|
|
Activated flashing beacons |
Flashing lights near a crosswalk that alert drivers when activated by a pedestrian |
|
|
|
Rectangular rapid flashing beacon |
Apparatus consisting of two LED flashers placed on either side of a pedestrian warning sign that flash in a left to right pattern |
|
|
|
Leading pedestrian interval |
Traffic signal cycles that give pedestrians a head start before the light turns green for motorists |
|
|
|
Prohibition of permissive left turns |
This treatment involves reconfiguring signal heads to eliminate permissive left turns; drivers must wait for a left-turn arrow to make left turns |
|
|
|
Median refuge island |
Raised islands placed in the street at intersection or midblock locations to separate crossing pedestrians from motor vehicles |
|
|
|
Danish offset |
Advance yield markings and “Yield Here to Pedestrians” signs at high-visibility crosswalks; the crosswalks orient pedestrians to face oncoming traffic |
|
|
|
Dynamic lighting |
Crosswalk lighting that only comes on at night when activated by pedestrians |
|
|
|
Self-Evaluations
Field teams consisting of city staff, university researchers, and other local partners in the three cities assessed the impacts of the countermeasures through self-evaluations. To assess the site-specific impacts, each team developed its own deployment strategies and experimental designs, albeit somewhat differently.
Although the Miami and San Francisco field teams deployed many of the countermeasures at multiple sites, they selected one or more sites for the study of each countermeasure and collected data at those sites only. The countermeasure under study was always the first and only one deployed to allow for a before-and-after comparison of the data. The Miami team also conducted several studies where it varied the treatments of countermeasures at the study sites. For example, after testing the impacts of the electronic “No Turn on Red” sign, the team then tested and compared the impacts of static and conditional “No Turn on Red” signs.
“Overall, our evaluation approach was very strong,” says Frank Markowitz, senior transportation planner with the San Francisco Municipal Transportation Agency, who served as a project manager for the San Francisco study. “But some impacts are hard to measure. A device like automated pedestrian detection to extend crossing time may have little noticeable effect, especially on pedestrian behavior, but could make a difference in every 1 in 10,000 crossings that prevents injury.”
In Las Vegas, the researchers used a multistage approach to deploy and evaluate a variety of countermeasures at 14 study sites. Each stage allowed for a before-and-after analysis of the impacts of the countermeasures. However, only the impacts of the countermeasures in the first stage could be compared to the true baseline. In subsequent stages, the researchers could measure only the incremental impacts.
According to Srinivas S. Pulugurtha, associate professor and assistant director of the Center for Transportation Policy Studies at the University of North Carolina at Charlotte, who was a project manager on the Las Vegas study, although the “results were generally encouraging, lack of time between different installations leaves some ambiguity of the effectiveness of each countermeasure.”
Measuring Effectiveness
At the conclusion of the self-evaluations, FHWA completed a study that brings together the findings from the States’ evaluations and contains crosscutting analyses of those countermeasures deployed by more than one of the field teams. FHWA published the results of its study in Pedestrian Safety Engineering and ITS-Based Countermeasures Program for Reducing Pedestrian Fatalities, Injury Conflicts, and Other Surrogate Measures Final System Impact Report, available at http://safety.fhwa.dot.gov/ped_bike/tools_solve/ped_scdproj/index.cfm. The report discusses the evaluation results for 18 countermeasures.
Because the effects of a countermeasure on crashes may take years to be fully realized, FHWA did not have crash data available for Las Vegas and San Francisco during its evaluation of their projects, although the information was available for Miami. Instead, FHWA researchers looked at measures of effectiveness (MOEs) related to pedestrian and driver behavior. The MOEs included vehicle speed, percentage of drivers braking when pedestrians are present, percentage of pedestrians trapped in a crosswalk, percentage of pedestrian-vehicle conflicts, percentage of drivers stopping or yielding, and percentage of illegal pedestrian crossings.
By comparing MOEs across the three cities’ sites, FHWA determined seven highly effective countermeasures: leading pedestrian intervals, pedestrian countdown signals, instreet pedestrian signs, activated flashing beacons, rectangular rapid flashing beacons, call buttons that confirm the press, and Danish offsets combined with high-visibility crosswalks, advance yield markings, and “Yield Here to Pedestrians” signs. Each of these countermeasures offers something more than traditional countermeasures, such as normal crosswalk markings and pedestrian crossing signs. For example, a rectangular rapid flashing beacon is much more visible and attention getting to motorists than the traditional pedestrian crossing sign. And leading pedestrian intervals, which allow pedestrians extra crossing time before cars can go, give more of an advantage to pedestrians than signals that release cars and pedestrians at the same time.
FHWA classified the remaining countermeasures as having either medium or low effectiveness. Those deemed medium were “No Turn on Red” signs, prohibition of permissive left turns, portable speed trailers, and automated pedestrian detection. Low-effectiveness countermeasures included high-visibility crosswalks, advance yield markings, “Look” pavement stencils, “Turning Traffic Yield to Pedestrians” signs, and “Pedestrian Zone” signs. In addition, FHWA noted that for some countermeasures, such as median refuge islands and dynamic lighting, the effectiveness depends on their application. However, the researchers only deployed and evaluated the advanced yield markings in San Francisco; this fact could have some impact on the study results, as the deployment was not more widespread.
In Miami, FHWA used MOEs and crash data to evaluate the countermeasures. Prior to FHWA’s project, NHTSA conducted a study to look at the effects of law enforcement and educational programs on reducing crashes in Miami-Dade County. As reported in Evaluation of the Miami-Dade Pedestrian Safety Demonstration Project (DOT HS 810 964), NHTSA collected data for zones in the county with abnormally high pedestrian-crash experiences. NHTSA collected data there for 9 years prior to the FHWA project, and an additional 2 years during FHWA’s project -- providing a total of 11 years of crash data. These data show an average of 51 crashes involving pedestrians per year after installation of the countermeasures and in combination with the NHTSA enforcement and educational efforts. These data represent a 50 percent reduction over the baseline level and a 41 percent reduction in crashes from the NHTSA project levels.
“The crash data showed that the installations were associated with large reductions in crashes in the treated corridors,” says Ron Van Houten, psychology professor at Western Michigan University, who was a project manager for the Miami study. “We also learned a good deal about the behavioral effects of a number of the treatments. For example, pushbuttons that confirm they have been pressed increased the percentage of pedestrians who pushed the call button and the percentage of pedestrians who waited for the WALK indication.”
Lessons Learned
Despite mixed results due to the wide range of real-world variables (no two sites are exactly the same), the project demonstrated that implementing carefully planned and targeted countermeasures can help improve pedestrian safety. The study also generated guidance for selecting, installing, and educating the community on countermeasures.
To select an appropriate treatment, local engineers first must evaluate the characteristics of a particular intersection or crossing area and deploy countermeasures based on engineering studies of the individual locations. No device or method will work well in every location because each site is unique. For example, Las Vegas has some wide roads, while Miami’s roads tend to be narrower. Road width can be problematic with some countermeasures, such as the instreet pedestrian signs, which work best on narrower roadways where they are more visible to drivers.
Proper placement of the countermeasure also is important. For example, the instreet pedestrian signs lasted only a few hours at some of the study locations because they are placed in the center of the road and are easily run over by large vehicles. These signs will likely perform better in areas with minimal truck traffic or where they can be placed on a median.
Another necessary element to consider before deciding on and implementing treatments is the road users. Pedestrians and motorists might initially be confused by a new treatment, so localities should make a special effort to educate community members about the use of any new treatments. Educational and communication efforts should target the specific audience. For example, if there is a large non-English-speaking population, localities should translate public service messages into the appropriate languages to reach the target audiences successfully.
“The lessons we’ve learned from the pedestrian countermeasure study are vital steppingstones to understanding how to better protect pedestrians,” says FHWA’s Toole. “We think this is a promising approach and hope that other localities will use what we’ve done here to help them reduce pedestrian injuries and fatalities.”
Pedestrian safety improvements such as the ones deployed during this study are likely eligible for funding under most categories of Federal-aid funds. The most applicable funding categories would be Transportation Enhancements, Safe Routes to School, and Highway Safety Improvement Program.
Tamara Redmon is a program manager for the Pedestrian Safety Program in FHWA’s Office of Safety. She has worked for FHWA for 19 years. She develops products and programs to help reduce pedestrian and bicyclist crashes, fatalities, and injuries. Recent accomplishments include development of a 15-year pedestrian strategic plan and delivery of a webinar series on designing for pedestrian safety. She holds a bachelor’s degree from Virginia Tech and a master’s degree from Marymount University.
For more information, contact Tamara Redmon at 202–366–4077 or tamara.redmon@dot.gov. To view the final reports for each location and FHWA’s evaluation, visit http://safety.fhwa.dot.gov/ped_bike/tools_solve/ped_scdproj/index.cfm.
Article reprinted from the Federal Highway Administration's January/February 2001 issue of Public Roads.