


Consumer Information Regulations; Federal Motor Vehicle Safety Standards; Rollover Prevention |
|---|
 Topics: National Highway Traffic Safety Administration
|
Barry Felrice
Federal Register
28 June 1994
[Federal Register: June 28, 1994]
=======================================================================
-----------------------------------------------------------------------
DEPARTMENT OF TRANSPORTATION
National Highway Traffic Safety Administration
49 CFR Part 575
[Docket No. 91-68; Notice 03]
RIN 2127-AC64
Consumer Information Regulations; Federal Motor Vehicle Safety
Standards; Rollover Prevention
AGENCY: National Highway Traffic Safety Administration (NHTSA), DOT.
ACTION: Notice of proposed rulemaking (Consumer Information
Regulation); Termination of rulemaking (Federal Motor Vehicle Safety
Standard).
-----------------------------------------------------------------------
SUMMARY: As part of its comprehensive efforts to address the problem of
light vehicle rollover, this agency is proposing a new consumer
information regulation that would require that passenger cars and light
multipurpose passenger vehicles and trucks be labeled with information
about their resistance to rollover. This information would enable
prospective purchasers to make choices about new vehicles based on
differences in rollover risk; motivate manufacturers to give more
priority to rollover stability in designing their vehicles; and inform
motorists that they can reduce the risk of injury in a rollover by
wearing their safety belts. NHTSA believes that this would reduce the
number of injuries and fatalities from rollover accidents.
DATES: Comment Date: Comments must be received by August 29, 1994.
ADDRESSES: Comments should refer to the docket and notice number of
this notice and be submitted to: Docket Section, Room 5109, National
Highway Traffic Safety Administration, 400 Seventh Street, SW.,
Washington, DC 20590. (Docket Room hours are 9:30 a.m.-4 p.m., Monday
through Friday.)
FOR FURTHER INFORMATION CONTACT: Gayle Dalrymple, Office of Vehicle
Safety Standards, NRM-11, National Highway Traffic Safety
Administration, 400 Seventh Street, SW., Washington, DC 20590.
Telephone: (202) 366-5559.
SUPPLEMENTARY INFORMATION:
Table of Contents
I. The Rollover Crash Problem
II. Relationship to Other Agency Activities
A. Agency Efforts to Address the Rollover Crash Problem
B. Consumer Information Activities
III. Background
A. Statutory Requirement for Rulemaking
B. ANPRM and the Planning Document
C. Comments on the ANPRM and the Planning Document
IV. Summary
A. Summary of Agency Decision Not to Propose a Vehicle Standard
B. Summary of Proposed Consumer Information Regulation
V. Agency Analysis of the Vehicle Stability Metrics
A. Identification of Vehicle Stability Metrics
B. Analysis of Importance of Factors
1. Additional Analyses since the ANPRM
2. Predictive Power of the Metrics
VI. Decision Not to Propose a Vehicle Stability Standard
A. Estimates of the Benefits of a Standard
1. Rollover Risk Reduction
2. Predicted Single Vehicle Accident Rate
3. Injury/Fatality Rate Reduction
B. Estimates of the Costs of a Standard
C. Conclusions
VII. Proposed Consumer Information Regulation
A. Rationale
B. Proposed Label
C. Stability Metrics
1. Critical Sliding Velocity
2. Tilt Table Angle
D. Timing of Information Provided by the Manufacturers and NHTSA
E. Benefits
F. Costs
VIII. Final Stage Manufacturers and Alterers
IX. Rulemaking Analyses and Notices
A. Executive Order 12866 and DOT Regulatory Policies and
Procedures
B. Regulatory Flexibility Act
C. Paperwork Reduction Act
D. National Environmental Policy Act
E. Executive Order 12612 (Federalism)
F. Civil Justice Reform
X. Effective Date of Final Rule
XI. Submission of Comments
I. The Rollover Crash Problem
Rollover crashes occur for many reasons, and involve the
interaction of a variety of factors including the driver, the roadway,
the vehicle, and environmental conditions. The relationship of these
various factors to rollover crashes can be examined by analyzing data
from various sources.
The agency estimates that there were 220,000 rollover crashes
involving passenger cars, and multipurpose passenger vehicles and
trucks under 4,536 kilograms (10,000 pounds) gross vehicle weight
rating (collectively, ``light trucks'') in 1991. These resulted in
9,186 fatalities; 56,000 occupants of these vehicles received serious,
incapacitating injuries. These numbers have remained relatively
constant over the past six years. Ejections are responsible for 63
percent of the fatalities. Safety belts are used by only 13 percent of
the fatally injured occupants.
Of the 220,000 rollover crashes, 207,000, or 94 percent, were
single vehicle crashes and 192,000 of these, or 93 percent, occurred
off the road. Various accident studies have indicated that loss of
vehicle directional control is a prelude to rollover in 50 percent to
80 percent of all rollover crashes.
For the years 1985-1991, small cars had the greatest number of
rollover fatalities, followed by standard-size pickup trucks. However,
pickup trucks and sport utility vehicles have fatality rates per
million registered vehicles between two and three times as great as
that of passenger cars. The difference between the numbers of rollover
fatalities and the rollover fatality rates for particular vehicle types
is a result of the relative proportions of various types of vehicles in
the fleet. There are currently many more small cars than pickup trucks
and sport utility vehicles on the road today.
(A more extensive discussion of rollover statistics, and the
sources for this information, can be found in the ``Addendum to
Technical Assessment Paper,'' NHTSA 1994, which is in Docket No. 91-68,
Notice 03.)
II. Relationship to Other Agency Activities
A. Agency Efforts To Address the Rollover Crash Problem
The agency believes that no single type of rulemaking or other
agency action could solve all, or even a majority of, the problems
associated with rollover. Accordingly, it is pursuing a broad range of
actions to address those problems.
First, NHTSA has published an NPRM to reduce the potential for
injuries to the head from contact with upper interior components (58 FR
7506, February 8, 1993). The comment period was reopened to December 1,
1993 (58 FR 54099, October 20, 1993) and a public hearing was held on
November 15, 1993. As explained in the Addendum to Technical Assessment
Paper, NHTSA's research indicates that head injuries are the most
prevalent type of injury associated with rollovers. The agency expects
to issue a final rule on this subject in late 1994.
Second, with respect to anti-lock brake systems, the agency has
published an advance notice of proposed rulemaking (ANPRM) for light
duty vehicles (January 4, 1994, 59 FR 281). (``Light duty vehicles''
include cars, vans, pickup trucks and sport utility vehicles with a
gross vehicle weight rating of 4,536 kilograms (10,000 pounds) or
less.) Since most vehicles involved in rollovers lose their
longitudinal stability before leaving the roadway, where they then trip
and roll over, and since anti-lock brake systems are designed to
enhance the longitudinal stability of a vehicle, a requirement for
anti- lock brakes could reduce the number of rollovers. NHTSA's
preliminary evaluation of rear-wheel anti-lock brake systems, the type
of anti-lock brakes most often found on light trucks, indicates that
anti-lock brakes on light trucks are effective in reducing the number
of nonfatal single vehicle accident rollovers for almost every type of
truck, under any type of road condition. Reductions of single vehicle
accident rollovers were typically in the range of 30 percent to 40
percent. NHTSA is continuing to analyze the data and a comprehensive
report of the findings will be published at a later date. (The
preliminary evaluation is available in Docket No. 70-27-GR-026.)
Third, as noted above, ejections are a frequent occurrence in fatal
rollover crashes. To attempt to reduce the frequency of ejections, the
agency is conducting research on glass/plastic side windows and
improved door latches. Preliminary research results should be available
within the next year to enable NHTSA to determine if rulemaking should
be pursued in these areas.
Fourth, the agency is conducting research on improvements to
vehicles' roof strength that could reduce head and neck injuries. A
decision whether to begin rulemaking on this subject is expected in
1994.
Fifth, as noted above, safety belt use is very low among persons
fatally or seriously injured in rollover crashes. NHTSA promotes
increased use of safety belts through public awareness and education
efforts and by supporting the implementation and enforcement of state
safety belt use laws. Agency occupant protection awareness and
education activities include national media campaigns; outreach through
national health, medical, civic, and intergovernmental organizations;
and, administration of Section 402 state highway safety program funds.
The agency promotes effective state safety belt usage laws by
conducting evaluation studies and demonstration projects, training law
enforcement personnel, and by administering the Section 153 state
incentive grant program.
In addition, NHTSA has contracted with the Advertising Council to
prepare two ``Vince and LarrySM'' (the agency's safety belt
``spokespersons'') public service announcements (PSAs) for television,
and one ``Vince and LarrySM'' PSA for radio, on the specific
benefits of safety belts in rollover crashes. One of the television
PSAs and the radio PSA were available at the end of March, 1994. The
other television PSA will be available approximately six months later.
These safety belt initiatives will supplement the other actions to
address the rollover problem.
Sixth, it is well known that rollover crashes have a high incidence
of alcohol involvement. The agency has numerous programs and activities
aimed at reducing alcohol-related crashes, injuries, and fatalities,
which follow two fundamental strategies: information-education (such as
Advertising Council PSAs on television) and laws-enforcement-sanctions
(such as .08 BAC, sobriety checkpoints, and increasingly severe
sanctions for repeat offenders). Section 410 grants to states provide
incentives to states to use these strategies. These combined strategies
have been effective as alcohol-related fatalities have decreased 30
percent over the past 10 years.
Seventh, and finally, the agency is issuing this notice regarding
vehicle stability requirements and consumer information.
B. Consumer Information Activities
NHTSA believes that consumer and manufacturer behavior can be
affected through the provision of consumer information regarding
vehicle safety. The agency's experience with the New Car Assessment
Program (NCAP) demonstrates the power of consumer information. Under
the NCAP Program, the agency tests the ability of vehicles to protect
their front seat occupants in frontal crash tests. The tests are
similar to those conducted under Standard No. 208, Occupant Protection,
to determine whether vehicles meet the Standard's injury criteria,
except that the Standard's tests are conducted at 30 mph, while NCAP
tests are conducted at 35 mph. Several manufacturers have informed the
agency that they view it as important to perform well in the NCAP
tests, even though there is no regulatory requirement to do so. The
decline in the injury scores in NCAP tests over time for all
manufacturers, as reported in ``Report on the Historical Performance of
Different Auto Manufacturers in the New Car Assessment Program Tests,''
NHTSA, August 1993, can also be attributed partially to NCAP.
The agency believes that further safety improvements could be
gained through providing consumers with information about additional
aspects of new vehicle safety performance. NHTSA recently conducted a
series of 15 focus groups, comprised of members of the public, to
examine the type and format of desired consumer information about
vehicle safety. (See ``Focus Groups on Traffic Safety Issues: Public
Response to NCAP,'' S.W. Morris & Company, Inc., August 1993, which can
be found in Docket No. 79-17, Notice 01, or ``New Car Assessment
Program--Response to the NCAP FY 1992 Congressional Requirements,''
Report to the Congress, December 1993, which can be found in Docket No.
97-17, Notice 39). One of the topics examined was the current NCAP and
how it could be improved. In response to the results of the focus group
work, the agency has changed the format for NCAP test results. The new
format responds to consumer demand for reporting results in a way that
is less technical and easier to understand.
The focus groups also indicated that the agency's consumer safety
information activities should be expanded to include additional kinds
of crashes, including side impacts and rollovers. The potential
importance of providing broader safety information about new light duty
vehicle performance can be seen from figures regarding the proportion
of fatalities in each of the three most important types of crashes. In
1991, frontal crashes accounted for 39 percent of all fatalities
involving light duty vehicle occupants, rollover crashes for 30
percent, and side impact crashes for 25 percent. Together, these three
types of crashes account for 94 percent of all fatalities. Information
on performance in all three types of crashes could provide consumers
with a comprehensive, balanced picture of the safety of new vehicles.
As part of its efforts to expand its consumer safety information
programs, NHTSA has sought participation and guidance from the general
public on the types and format of safety information to be provided to
consumers. On January 3, 1994, the agency published a request for
comments on whether to supplement the agency's efforts by holding a
public meeting to discuss, among other items, the expansion of the NCAP
program to other crash modes (59 FR 104).
Based on the foregoing, the agency plans to supplement this
rollover proposal with a future proposal for requiring that each new
vehicle have a window sticker providing information not only on vehicle
rollover resistance, but also on frontal and side impact crash
performance.
III. Background
A. Statutory Requirement for Rulemaking
The NHTSA Authorization Act of 1991 (the Act) (part of the
Intermodel Surface Transportation Efficiency Act) requires the agency
to address several vehicle safety subjects through rulemaking. One of
the subjects, set forth in section 2503(1), is protection against
unreasonable risk of rollovers of passenger cars, multipurpose
passenger vehicles, and trucks with a gross vehicle weight rating of
8,500 pounds or less and an unloaded vehicle weight of 5,500 pounds or
less.
Section 2502(b)(2)(A) of the Act required that NHTSA publish, no
later than May 31, 1992, an ANPRM or a notice of proposed rulemaking
(NPRM) on this subject. The January 3, 1992, ANPRM fulfilled this
mandate.
Section 2502(b)(2)(B)(i) of the Act provides that the agency must
complete a rulemaking action on rollover within 26 months of publishing
the ANPRM. The ANPRM was published on January 3, 1992; thus, this
rulemaking action was to have been completed by March 3, 1994. Section
2502(b)(2)(B)(ii) of the Act provides that this rulemaking will be
considered completed when NHTSA either publishes a final rule or
decides and announces that it is not promulgating a rule.
B. ANPRM and Planning Document
NHTSA announced in its January 3, 1992 ANPRM on the rollover
problem that it was considering various regulatory actions to reduce
the frequency of vehicle rollovers and/or the number and severity of
injuries resulting from vehicle rollovers (57 FR 242). The agency
requested comments on potential regulatory actions in the areas of: (1)
Improved stability; (2) improved crashworthiness; and (3) consumer
information. NHTSA said that it might issue a rule or rules in any one
of these three categories, or in any combination of them.
The ANPRM discussed the agency's statistical analyses of the
interaction of driver characteristics, vehicle stability metrics,
roadway and environmental conditions. The notice described the
following vehicle stability metrics as having a potentially significant
role in vehicle rollover: center of gravity height; static stability
factor; tilt table ratio; side pull ratio; wheelbase; critical sliding
velocity; rollover prevention metric; braking stability metric; and
percent of total vehicle weight on the rear axle. A vehicle stability
metric is a measured vehicle parameter that presumably is related to
the vehicle's likelihood of rollover involvement. To supplement the
ANPRM, a Technical Assessment Paper that discussed testing activities,
testing results, accident data collection, and analysis of the data was
placed in the docket on January 6, 1992. A description of the
individual metrics can be found in the Technical Assessment Paper.
(Note: For the remainder of this notice, ``tilt table angle'' is
used in place of ``tilt table ratio,'' regardless of the term used
in any other document. NHTSA is using ``tilt table angle'' because
the agency is proposing tilt table angle as one of the possible
measurements to be used in the proposed consumer information
regulation. Tilt table angle is the angle at which the last uphill
tire of a vehicle lifts off a tilting platform. Tilt table ratio is
the tangent of the tilt table angle and is believed to be harder for
the average consumer to understand.)
During the development of the ANPRM and subsequent to receiving and
analyzing comments to the ANPRM, it became obvious that no single type
of rulemaking could solve all, or even a majority of, the problems
associated with rollover. This view was strengthened by the agency's
review and analysis of the comments on the ANPRM. To emphasize this
conclusion and inform the public further about the complicated nature
of the light duty vehicle rollover problem, the agency released a
document titled ``Planning Document for Rollover Prevention and Injury
Mitigation'' at a Society of Automotive Engineers meeting on rollover
on September 23, 1992. The Planning Document gave an overview of the
rollover problem and a list of alternative actions that NHTSA was
examining to address the problem. Alternatives for regulatory action
and a schedule for decisions on each were included. The current status
of the presented alternative actions was discussed earlier in this
notice. The document was placed in Docket No. 91-68; Notice 02, on the
same day. NHTSA published a notice in the Federal Register announcing
the availability of the Planning Document and requesting comment
(September 29, 1992; 57 FR 44721).
C. Comments on the ANPRM and the Planning Document
Forty-two comments concerning the ANPRM and the Planning Document
were received. A Summary of Comments was placed in the docket on
September 15, 1993. Ten commenters addressed the Planning Document,
eight of whom had also commented on the ANPRM. Responses to the
Planning Document, for the most part, were abridged forms of the
commenters' responses to the ANPRM.
All the commenting vehicle manufacturers asserted that, while
stability metrics are statistically related to the rates with which
single vehicle accidents result in rollovers, they are not causally
related to rollover. Therefore, the manufacturers asserted, the agency
cannot issue a regulation based on any one of these metrics solely
because of its statistical correlation with accident data. Automotive
Testing, BMW, Ford, GM, the American Automobile Manufacturers
Association (AAMA, then known as the Motor Vehicle Manufacturers
Association), and VW claimed that stability metrics are insufficient by
themselves to explain a vehicle's degree of involvement in rollover
crashes. These commenters stated that driver and environmental factors
outweigh the contributions of vehicle factors to the likelihood of a
single vehicle accident becoming a rollover. Nevertheless, most
commenters addressed the relevancy of several of the individual metrics
the agency considered for a vehicle stability rulemaking.
Tilt table angle, one of the metrics being proposed in this notice,
appeared to be more acceptable to the commenters than the other
stability metrics. While side pull ratio was favored by Automotive
Testing, Chrysler, GM, and Nissan, all these commenters also commented
favorably on aspects of tilt table angle. Static stability factor was
favored by only Perrone Forensic Consulting, who also commented
favorably on tilt table angle. All other commenters who indicated a
preference among the metrics discussed in the ANPRM favored tilt table
angle. However, Chrysler, Ford, GM, Isuzu, and VW claim vehicle changes
made to improve a vehicle's tilt table performance may degrade a
vehicle's control and handling attributes. Chrysler said that the
repeatability of results from the tilt table procedure was unknown. On
the other hand, Advocates for Highway and Auto Safety, the
International Organization of Motor Vehicle Manufacturers, and GM
stated they believe that the procedure is repeatable. Chrysler and AAMA
also commented that the tilt table test is not a standard practice and
its measurement error has not been established.
Commenters did not respond directly to the idea of using critical
sliding velocity, which is also being proposed for use in this notice.
However, most manufacturers commented that center of gravity height (a
measurement necessary to calculate critical sliding velocity) is
difficult to measure and that the measurement is not repeatable.
Therefore, according to these commenters, any metric which uses center
of gravity height would be impracticable.
The commenters also focussed on crashworthiness improvements. By
far the most favorable crashworthiness countermeasure cited by the
commenters was increased seat belt use to prevent ejections. In
general, commenters believe that more benefits could be gained through
increased seat belt use than through any vehicle related
crashworthiness or crash avoidance countermeasure. Some commenters also
favored improved roof structures including roll bars or cages, but
Ford, GM, Nissan, and VW believe the installation of a roll bar or cage
raises the vehicle's center of gravity and decreases rollover
stability. Other suggestions were for improved glazing, improved latch/
lock/hinge systems for doors, anti-lock brakes, bumper height
regulations, removal of drunk and otherwise impaired drivers from the
road, stricter enforcement of speed limits, and improved public
awareness of the causes of rollover crashes as ways to reduce rollover
casualties.
Finally, Chrysler, GM, AAMA, and Toyota claimed that labeling
vehicles with a stability metric would be simplistic and could mislead
consumers, giving them a false sense of security in a vehicle labeled
with a high stability metric (i.e., a metric indicating comparatively
high resistance to rollover). These commenters believe that consumers
could consider the metric to be an absolute measure of rollover
likelihood, regardless of driver behavior or roadway conditions.
IV. Summary
A. Summary of Agency Decision Not To Propose a Vehicle Standard
In analyzing whether to proceed with a vehicle stability
rulemaking, the agency identified several criteria that had to be met
before proposing a safety standard. First, the identified vehicle
metrics had to have a causal relationship to the likelihood of
rollover. For example, center of gravity height affects rollover
likelihood; the color of the vehicle does not. Second, the metric had
to have a statistical relationship to rollover frequency. Third,
improvement in the metric should result in significant safety benefits
at a reasonable cost without having the effect of necessitating the
radical redesigning of one or more types of vehicles. As discussed
below, the agency identified two metrics that met the first two
criteria, but not the third.
To determine whether it was appropriate to propose a new vehicle
safety standard, NHTSA examined the complex interactions between driver
behavior, vehicle properties, and roadway characteristics which result
in rollovers. The suitability of a vehicle safety standard based on
rollover stability depends on the importance of rollover stability, as
represented by a vehicle metric, relative to other rollover influences,
such as vehicle handling properties, vehicle condition, the nature of
the roadway and shoulder terrain, and driver behavior. The agency
sought to determine whether vehicle stability metrics are significant
variables in a statistical model of the risk of rollover. If they are,
then a standard regulating stability might be justified, depending on
the results of a comparison of benefits and costs for such a standard.
After analyzing a number of static and dynamic rollover metrics,
the agency concluded that two vehicle metrics, tilt table angle and
critical sliding velocity, can account for about 50 percent of the
variability in rollover risk in single vehicle accidents, after
considering driver, roadway, and environmental factors. (Rollover risk
is the number of single vehicle rollovers involving a particular make/
model divided by the number of single vehicle crashes of all types
involving the same make/model.) This statistical analysis was conducted
on all light duty vehicles treated as a group. However, analysis of
accident data indicated that certain subgroups of light duty vehicles
are more likely to roll over than other subgroups. For example, sport
utility vehicles and compact pickup trucks tend to be the most likely
vehicles to roll over. Large passenger cars tend to be the least likely
to roll over. The importance of this difference is that if significant
benefits are to be achieved, then changes in the metric should be made
that affect passenger cars since nearly 60 percent of rollover
fatalities occur in those vehicles.
The agency's analysis showed that setting a performance level high
enough to affect passenger cars, would require redesign of nearly all
sport utility vehicles, vans, and pickup trucks. Using a single value
of one of these metrics as the performance standard for all light duty
vehicles would have resulted in the radical redesign of the
characteristics many, and in some cases all, vehicles of certain
classes. That degree of redesign would have raised issues of public
acceptance and possibly even the elimination of certain classes of
vehicles as they are known today.
To avoid this consequence, the agency then examined whether several
values for these metrics, each applying to a different class of
vehicles (e.g., one value for passenger cars and a different value for
light trucks) would be feasible. Since the statistical analyses
discussed above were conducted on all light duty vehicles treated as a
group, it was necessary to determine whether either of the stability
metrics exhibited sufficiently high levels of correlation to assure the
agency that a requirement applying to only one class of vehicle would
be expected to reduce the incidence of rollovers for vehicles in that
class. As explained later in this notice, the agency found that the
statistical correlations of the metrics with rollover accident data
within a class of vehicles was not so consistent as for all vehicles
grouped together. This weakening of the predictive ability of the
metric is, to some extent, the result of the smaller range of the
metric within any class of vehicles together with the inherent
variability in the data. Based on this analysis, and the general
analysis of costs and benefits discussed later, the agency determined
that proposing a standard specifying one minimum stability value for
cars and others for various classes of light trucks could not be
justified.
The agency also determined that, considering the costs and benefits
involved, proposing a safety standard specifying a single minimum
stability value for both cars and light trucks could not be justified.
While light trucks have lower stability measurements than cars do, the
greatest number of rollover-related deaths and injuries occur in
passenger cars because of their larger population size. Therefore, if
the agency wished to set a stability minimum high enough to realize
significant reductions in the number of fatalities in all light duty
vehicles, it would have to set the minimum above the stability number
of most light trucks. The costs of such a standard, in terms of the
cost of vehicle redesign and the loss of consumer-desired attributes,
were determined to be very high, as entire classes of light trucks
would probably need to be substantially redesigned to meet such a
standard. This redesign could result in the elimination of some vehicle
types, e.g., sport utility vehicles, as they are known today.
Based on this analysis, NHTSA has decided not to propose a vehicle
stability rule, and is deferring any further action on this subject
until such time as information becomes available demonstrating the cost
effectiveness of such a rule. The agency may reinitiate such a
rulemaking upon receipt of such information. This termination of
rulemaking on vehicle stability fulfills the statutory mandate of
section 2502(b)(2)(B)(i). However, through the consumer information
proposal being published today, and the other actions mentioned above,
NHTSA is continuing to take a comprehensive approach to reducing
rollover casualties.
B. Summary of Proposed Consumer Information Regulation
While NHTSA is terminating rulemaking on a vehicle stability
standard, NHTSA believes that the correlation between stability and
rollover risk is significant enough to justify proposing a consumer
information regulation to relieve the possibility of uninformed risk.
The agency believes that informing consumers of the relative resistance
of different vehicles to rollover will influence consumers to purchase
more stable vehicles and encourage manufacturers to improve the
stability of their vehicles. The agency believes that these results are
possible based on its assessment of how consumers and manufacturers
reacted to the provision of frontal crashworthiness information through
the New Car Assessment Program.
The consumer information regulation being proposed by the agency
would require manufacturers of passenger cars and light trucks to label
their vehicles with information relating to rollover stability. To that
end, manufacturers would be required to report a stability metric for
each vehicle make/model to NHTSA by January 1 of each year.
Manufacturers would decide how to group vehicle make/models for the
purpose of reporting stability metrics for those groups. To ensure that
the information is neither understated nor overstated, the reported
stability metric would be measured with a specified procedure and an
accuracy tolerance on reported data would be required. NHTSA would use
the information reported by manufacturers to provide the manufacturers
with the ranges of metrics for both passenger cars and light trucks by
April 1 of each year. For comparison purposes, these ranges would be
included on vehicle labels.
New vehicles manufactured after September 1, 1996 would be required
to have a prescribed window label listing the metric of the labeled
vehicle, the range of that metric for cars and the range for light
trucks. In addition, prescribed language on the label would explain the
significance of the metric, warn consumers that all vehicles can and do
roll over, and remind consumers to always wear seat belts. The proposed
regulation would also require manufacturers to include the information
on the vehicle label in the vehicle's owner's manual.
The agency requests comment on whether or not the proposed vehicle
label should be a permanent sticker, in addition to the window label
which would be removed after first sale. If a commenter believes the
label should be permanent, NHTSA requests comment on whether the
permanent sticker should be required on all vehicles, or only some
subset of vehicles with lower rollover stability. Finally, NHTSA
requests suggestions on placement and size of a permanent sticker. A
permanent sticker would be useful to purchasers of used vehicles and
drivers of rental vehicles.
NHTSA is considering two metrics for providing information
regarding rollover stability: critical sliding velocity and tilt table
angle. Critical sliding velocity is a measure of the minimum lateral
(sideways) vehicle velocity required to initiate rollover when the
vehicle is tripped by something in the roadway environment, e.g., a
curb. Tilt table angle is the angle at which the last uphill tire of
the vehicle lifts off a platform as the platform is increasingly
tilted.
NHTSA is proposing two different options for specifying stability
information using these metrics. First, NHTSA may select one of the two
metrics to appear on the label. For example, if the agency selected
tilt table angle, it would require that the specific angle for each
vehicle be shown on its label. Second, NHTSA may require the label to
include a nonquantitative statement concerning the vehicle's rollover
resistance based on one or both of the metrics. For example, instead of
stating a specific angle, the label might use symbols such as one, two,
or three stars.
V. Agency Analysis of the Vehicle Stability Metrics
A. Identification of Vehicle Stability Metrics
The agency has concluded that the two metrics with the best
correlation to accident statistics are tilt table angle, a static
measurement, and critical sliding velocity, a metric calculated from
static and dynamic vehicle measurements and expressed as velocity,
i.e., units of feet per second, miles per hour, or kilometers per hour.
Tilt table angle includes the influences of the vehicle's mass,
center of gravity height, track width, and suspension movement, all of
which are physically related to rollover stability. Because it does not
require an independent measurement of center of gravity height, it is
more practicable, less costly, and more repeatable than most static
rollover metrics.
Critical sliding velocity includes the roll moment of inertia as
well as the various static factors mentioned above in its calculation.
The Technical Assessment Paper found critical sliding velocity alone to
have less correlation with rollover accident statistics than tilt table
angle, but found it to be a statistically significant addition to a
model already containing tilt table angle. However, an error in the
computation of critical sliding velocity was made in the Technical
Assessment Paper. When the logistic regression was repeated with the
correct critical sliding velocity values and data for more vehicle
make/models and additional accident years, NHTSA found the correlation
of critical sliding velocity to accident statistics for all light duty
vehicles grouped together and for the light truck and passenger car
categories to be better than that for tilt table angle. The Addendum to
Technical Assessment Paper contains the corrected analysis.
B. Analysis of Importance of Factors
1. Additional Analyses Since the ANPRM
Since the ANPRM, new vehicles have been added to the data base and
their metrics measured. Several make/models have been tested in
different configurations to determine the range of metrics within a
make/model, given the different available original equipment options.
Also included are several make/models of trucks and vans with anti-lock
brakes as standard equipment and several make/models of high sales
volume passenger cars equipped with anti-lock brakes. A complete list
of all vehicles measured to date, their tilt table angles and critical
sliding velocities, and the ratio of the number of rollovers involving
a particular vehicle model to the number of single vehicle accidents
involving the same model (RO/SVA) in Michigan from 1986 through 1990
can be found in Docket 91-68, Notice 2.
2. Predictive Power of the Metrics
The agency performed two types of analyses attempting to separate
the influence of driver characteristics, road, and environmental
variables in the accident data so that the effect of vehicle rollover
stability could be isolated. A logistic regression analysis
individually considered every accident in a very large data base. Make/
models represented in a great number of accidents influenced the
results more than make/models with fewer accidents. A linear regression
analysis was also done on the rollover risk of make/models, adjusted
for differences in driver and road characteristics within their
individual accident data bases, but not weighted by differences in
accident numbers. The two analyses are discussed in detail in the
Addendum to Technical Assessment Paper.
These analyses were conducted using three statistical models: (a) A
model containing only driver, roadway, and environmental
characteristics; (b) a model containing driver, roadway, and
environmental characteristics, and critical sliding velocity; and (c) a
model containing driver, roadway, and environmental characteristics,
and tilt table angle. For the purposes of comparison, the analyses were
limited to accidents involving those make/models for which the agency
had both tilt table angle and critical sliding velocity data. This
results in an equal number of accidents, or observations (88,397), in
each statistical model.
The logistic regression predicts whether a single vehicle accident
will be a rollover based on the factors in a particular model. Then the
predicted outcomes of the individual accidents are compiled to predict
a rollover risk (rollovers per single vehicle accident) for each of the
128 make/models for which the agency has data on both metrics. This
predicted risk is then compared to the actual risk known from accident
data on these make/models. Two numbers are presented in the table below
for each of the statistical models. The first is the percent
variability explained by the comparison of the rollover risk predicted
by the logistic regression model and the actual rollover risk. The
second number is the percentage of the variability unexplained by the
model containing only driver, roadway, and environmental
characteristics which is explained by the addition of either tilt table
angle or critical sliding velocity. For example, the driver/road/
environmental model leaves 77 percent of the variability in the data
unexplained; 23 percent is explained. When tilt table angle was added
to the model to represent vehicle stability, 65 percent of the
variability in rollover risk was explained. The difference between the
77 percent unexplained variability in the driver/road variable model
and the 35 percent unexplained variability of the driver/road variable
plus tilt table angle model is 42 percent, which is 55 percent of the
unexplained variability in the driver/road variable model (42 percent/
77 percent). Slightly more than half of the variability unaccounted for
by driver and road characteristics was explained by the addition of
tilt table angle. Thus, the logistic regression analysis indicates that
stability, as measured by tilt table angle, is an important predictor
of the likelihood of a single vehicle accident becoming a rollover.
Substitution of critical sliding velocity produced similar results. A
complete discussion of the results of these analyses can be found in
the Addendum to Technical Assessment Paper in the docket.
Table 1.--Results of Logistic Regression Analysis for All Vehicles for
Which Tilt Table Angle (TTA) and Critical Sliding Velocity (CSV) Are
Known
------------------------------------------------------------------------
Percent
variability
Percent explained,
Model variability which is not
explained explained by D/
R/E only model
------------------------------------------------------------------------
D/R/E only.............................. 23 NA
D/R/E & TTA............................. 65 55
D/R/E & CSV............................. 75 68
------------------------------------------------------------------------
The linear regression analysis also demonstrates the predictive
power of tilt table angle and critical sliding velocity. This analysis
showed that tilt table angle accounts for about 53 percent of the
variability in rollover risk remaining after adjustment for differences
in driver and road characteristics. The analysis showed that critical
sliding velocity accounts for about 66 percent of the variability in
rollover risk remaining after adjustments for driver and road
characteristics. These compare to the 55 percent and 68 percent values
found by logistic regression. These figures demonstrate that the two
analytic methods are essentially in agreement regarding the statistical
significance of stability metrics to the prediction of rollover.
The results of both the logistic and linear regression analyses
performed by the agency suggest that a vehicle stability metric alone
can account for approximately 50 percent of the variability in rollover
risk in single vehicle accidents, for the population of make/models
studied. While ideally it would be desirable to have these variables
explain 100 percent of the remaining variability, such statistical
correlations are almost never achieved. The agency views these analyses
as demonstrating sound statistical and causal relationships between
these variables and the likelihood of rollover. At the same time, the
analyses show that other factors in addition to those analyzed are
affecting rollover risk, as 35 percent to 25 percent of the variability
in rollover risk is still unexplained after accounting for the driver,
roadway, and tilt table angle or critical sliding velocity,
respectively.
The above analyses used a Michigan accident data base combining
passenger cars, pickup trucks, vans, and sport utility vehicles. As
explained in section I, the rate of rollover fatalities and injuries
per million registered vehicles is higher for sport utility vehicles
and compact pickup trucks, but the absolute majority of harm occurs in
passenger cars, because of their large numbers in use. In the current
vehicle fleet, passenger cars generally have higher measured stability
than light trucks. Thus, a safety standard requiring a minimum level of
stability appropriate for all light duty vehicles would not be expected
to affect many present or future small cars and therefore would not
result in significant safety benefits. (For a further discussion of the
problems associated with a minimum standard, see the section below
entitled, ``Estimate of the Costs of a Standard.'')
Hence, the agency also examined the relative predictive capability
of the stability metrics to rollover risk for passenger cars and light
trucks separately, to investigate the possibility of setting a higher
minimum level of stability for passenger cars. The results are shown in
the table below, including a comparison to the results for all vehicles
considered as a single group (see Table 1). As with the analysis of all
vehicles considered as a single group, these analyses were limited to
make/models for which both tilt table angle and critical sliding
velocity were known.
Table 2.--Results of Logistic Regression Analysis for Vehicles by Class
----------------------------------------------------------------------------------------------------------------
TTA as metric CSV as metric
-----------------------------------------------------------------
Percent variability Percent variability
Vehicle class ---------------------- Percent ---------------------- Percent
D/R/E explain D/R/E explain
only + metric only + metric
----------------------------------------------------------------------------------------------------------------
All vehicle................................... 23 65 55 23 75 68
Lt. Truck only................................ 21 52 39 21 70 62
Car only...................................... 39 56 28 39 63 39
----------------------------------------------------------------------------------------------------------------
These results show that, while a good proportion of the variability
remaining in the driver/road/environmental model is explained by either
metric for the group containing all vehicles, when the vehicles are
divided into classes, the results are not consistent. The inconsistency
seen in the model results by vehicle class is, to some extent, the
result of the smaller range of the metric within any subgroup of
vehicles together with the inherent variability in the data. These
analyses and the analyses of benefits and costs discussed later,
indicate that different minimum standards for passenger cars and light
trucks cannot be supported using either tilt table angle or critical
sliding velocity.
VI. Decision Not To Propose a Vehicle Stability Standard
As discussed previously, NHTSA concluded that both of the vehicle
metrics, tilt table angle and critical sliding velocity, were
statistically and causally related to the likelihood of rollover in a
single vehicle crash. To determine whether to propose a vehicle
stability standard, NHTSA next compared the benefits and costs of such
a standard. A detailed discussion of the benefits analysis can be found
in ``Potential Reductions in Fatalities and Injuries in Single Vehicle
Rollover Crashes as a Result of a Minimum Rollover Stability
Standard,'' which has been placed in Docket No. 91-68, Notice 03. A
detailed discussion of the cost estimates can be found in the
Preliminary Regulatory Evaluation, which has also been placed in Docket
No. 91-68, Notice 03.
A. Estimate of the Benefits of a Standard
The agency made two basic estimates of benefits of a minimum
standard for rollover stability. One was based on the reductions in RO/
SVA predicted by the logistic regression model for increases in
critical sliding velocity. The other was based on reductions in RO/SVA
predicted for increases in tilt table angle. All other factors being
equal, it is reasonable to expect an inverse relationship between
rollover risk and either critical sliding velocity or tilt table angle.
Thus, the higher the lateral sliding velocity necessary to trip a
vehicle, the less likely it is to roll over, and vice versa. Similarly,
the greater the angle necessary to tip a vehicle from the tilt table,
the less likely it is to roll over, and vice versa.
To quantify the benefits of potential minimum standards for
rollover stability, NHTSA examined the net prevention of fatalities and
serious injuries associated with various minimum levels of critical
sliding velocity and tilt table angle. Fatality and injury levels were
estimated by using:
1. The reduction of the rollover risk predicted for increases in
critical sliding velocity or tilt table angle;
2. The number of single vehicle accidents per registered vehicle
expected to occur; and
3. The reduction in fatalities and/or injuries if a single vehicle
accident does not result in a rollover.
The estimate of the benefits of a minimum stability safety standard
incorporated several simplifying assumptions. First, the agency assumed
that the severity of the accidents would be reduced but that the
accidents would not be prevented. Because single vehicle rollover
accidents are more severe than single vehicle non-rollover accidents,
prevention of rollover reduces the number of serious injuries and
fatalities. However, under this scenario, the total number of single
vehicle accidents is assumed to remain constant. This assumption is
somewhat pessimistic, because an unknown number of crashes would most
likely be avoided. But the remaining assumptions used may tend to
overestimate the benefits since NHTSA also assumed:
1. The numbers of rollover injuries and fatalities prevented would
be proportional to the number of rollovers prevented, and
2. The fatality and injury rates of the late 1980s for the make/
models which would be affected by a minimum standard will remain
representative in the future.
The second assumption may overstate the benefits if increased
safety belt use in the 1990s, as is the goal of NHTSA, reduces the
overall harm from rollover accidents. That is, as belt use increases,
rollover casualties decrease, even though the number of rollover
crashes remains constant.
1. Rollover Risk Reduction
To estimate the reduction in the rollover risk that would be
obtained by changing a vehicle metric, the agency used logistic
regression to determine the sensitivity of rollover risk to changes in
critical sliding velocity or tilt table angle. The outcome of each
accident of the subject make/model in the data base was re-evaluated
individually changing the stability metric but retaining the other
vehicle, driver, and road characteristics present in the actual crash.
A new RO/SVA ratio was determined on the basis of the predicted outcome
of each accident.
To examine the sensitivity of the model to a change in critical
sliding velocity, the agency divided the range of critical sliding
velocities from 14.26 to 16.73 kilometers per hour (kph). The low end
of this range is representative of vehicles in NHTSA's database with
the lowest critical sliding velocity. The high end of this range is
representative of a critical sliding velocity equivalent to the 1.20
value for static stability factor recommended in the Wirth petition
(also equivalent to a tilt table angle of 46.4 degrees). (A discussion
of the Wirth petition can be found in the ANPRM, 57 FR 242, 244-45.)
The highest value in the range is greater than the proposed European
tilt table angle limit of 44.3 degrees, and in the agency's judgement
represents the highest practicable standard. A standard at the upper
limit of the range would affect 1,648,000 vehicles manufactured in
1991, including 87 percent of compact sport utility vehicles, 100
percent of standard vans, and 31 percent of compact pickups.
The agency then divided this range into six even increments and
calculated the RO/SVA for each increment for various classes of
vehicles. Each successively higher increment represents an increase in
critical sliding velocity of 0.41 kph. The agency then predicted the
decrease in single vehicle accident rollovers for each incremental
increase in critical sliding velocity. (See Table 3.)
Table 3.--Sensitivity of RO/SVA to Changes in CSV in kph Simulated by Logistic Regression Model for Vehicles of
CSV <16.73 kph
----------------------------------------------------------------------------------------------------------------
CSV range kph
Make/model --------------------------------------------------------------
14.26 14.68 15.09 15.50 15.91 16.32 16.73
----------------------------------------------------------------------------------------------------------------
Compact SUVs..................................... 0.434 0.420 0.406 0.391 0.378 0.364 0.350
Standard SUVs.................................... 0.347 0.334 0.320 0.307 0.294 0.282 0.269
Compact Pickup................................... 0.355 0.341 0.328 0.314 0.301 0.288 0.276
Minivan.......................................... 0.275 0.263 0.252 0.241 0.230 0.219 0.209
Standard Van..................................... 0.229 0.219 0.209 0.199 0.190 0.180 0.171
----------------------------------------------------------------------------------------------------------------
As an example, for vehicles with a critical sliding velocity
between 14.26 and 16.73 kph, an increase of 12 percent in critical
sliding velocity was predicted to decrease single vehicle accident
rollovers of compact sport utility vehicles by about 13 percent,
standard sport utility vehicles by about 15 percent, compact pickups by
about 15 percent, and minivans by about 16 percent. There is only one
standard van with a critical sliding velocity below 16.73 kph. Its
rollover risk is predicted to decrease 17 percent if its critical
sliding velocity were to increase 12 percent. A 12 percent increase in
critical sliding velocity represents a change of 1.65 kph, or four
increments. A complete discussion of these analyses can be found in the
paper ``Potential Reductions in Fatalities and Injuries in Single
Vehicle Crashes as a Result of a Minimum Stability Standard'' in the
docket.
A similar analysis was done using tilt table angle. For tilt table
angle, each increment was approximately equivalent to 0.75 degrees. For
vehicles with a tilt table angle between 42 and 46.4 degrees (the
equivalent of the critical sliding velocity range), an increase of 11
percent (also four increments, or 3.00 degrees) in tilt table angle was
predicted to decrease single vehicle accident rollovers among compact
sport utility vehicles by about 15 percent, standard sport utility
vehicles by about 19 percent, compact pickups by about 17 percent,
minivans by about 20 percent, and standard vans by about 22 percent.
(See Table 4.)
Table 4.--Sensitivity of RO/SVA to Changes in TTA Simulated by Logistic Regression Model for Vehicles of TTA
<46.4 deg.
----------------------------------------------------------------------------------------------------------------
TTA range
Make/model ----------------------------------------------------------------------------
42.0 deg. 42.8 deg. 43.5 deg. 44.3 deg. 45.0 deg. 45.7 deg. 46.4 deg.
----------------------------------------------------------------------------------------------------------------
Compact SUVs....................... 0.465 0.448 0.430 0.413 0.396 0.380 0.363
Standard SUVs...................... 0.293 0.278 0.264 0.249 0.236 0.223 0.210
Compact Pickup..................... 0.406 0.388 0.370 0.353 0.336 0.319 0.302
Standard Van....................... 0.178 0.168 0.158 0.148 0.139 0.130 0.122
Minivan............................ 0.265 0.251 0.238 0.225 0.212 0.200 0.189
----------------------------------------------------------------------------------------------------------------
2. Predicted Single Vehicle Accident Rate
To estimate the number of single vehicle accidents in a
hypothetical future vehicle population, NHTSA assumed that the future
population would have the same proportion of vans, pickups, and sport
utility vehicles as the 1991 production, and that the population would
have the same proportion of high and low critical sliding velocity and
tilt table angle vehicles within these categories.
NHTSA then distributed the numbers of serious injuries by vehicle
category (as tabulated by Data Link Inc., under contract to NHTSA)
among the 1991 example vehicles on the basis of relative production
volume, relative single vehicle accident involvement rate, and relative
rollover risk per single vehicle accident. (The Data Link reports are
available in Docket 91-68, Notice 2.) Data Link reported injuries and
fatalities by vehicle types: pickup truck, van, sport utility vehicle
(called MPV in Data Link reports), and car. NHTSA further divided the
vehicle types into subcategories of compact and standard to make
average accident rate and rollover risk more meaningful.
NHTSA also divided injuries and fatalities between compact and
standard versions of each vehicle type. To do this, NHTSA assumed that
rollover harm was proportional to the number of rollover accidents
within a vehicle type. The numbers of rollover accidents among compact
vehicles relative to those among their standard counterparts were
estimated by multiplying their 1991 production ratios by their single
vehicle accident per registered vehicle ratios and their RO/SVA ratios.
The total number of injuries and fatalities was then divided
proportionally.
The reduction in rollover harm for each type/size category is a
summary of the reductions in injuries and fatalities for each example
vehicle within the category if the tilt table angle for the category
were increased a specified level. The reduction in harm associated with
each affected vehicle is assumed to be proportional to its projected
reduction in rollover risk. A minimum tilt table angle standard of 42.8
degrees, an increase of one increment explained above, would be
expected to reduce serious rollover injuries by 13 and rollover
fatalities by 8. A minimum tilt table angle standard of 46.4 degrees,
the highest measurement in the range studied, would be expected to
reduce serious rollover injuries by 233 and rollover fatalities by 121,
if rollover avoidance were viewed as crash avoidance. A parallel
exercise was done using the rollover risk predicted using critical
sliding velocity as the stability metric in the logistic regression
model.
3. Injury/Fatality Rate Reduction
Because the agency assumed that a single vehicle accident would
still occur even though a rollover was prevented, it reduced these
estimates of benefits based on a comparison of the relative harm of
single vehicle accidents with rollover to that of similar accidents
without rollover. The comparison indicated that the overall fatality
rate for single vehicle rollover accidents was 2.07 times the fatality
rate for single vehicle accidents without rollover. When only accidents
occurring on roads with speed limits of 40-50 mph are considered, the
rollover accidents are 2.3 times as likely to result in fatality. When
accidents on 55-65 mph roads are considered, the fatality rate of
rollover accidents is 1.6 times that for other accidents. These
statistics suggest that rollover prevention is equivalent to about a 50
percent reduction in fatalities for the number of accidents in which
rollovers would be prevented.
Likewise, the injury data indicate an overall relative rate of
serious injuries (AIS 3+) 1.36 times greater for single vehicle
accidents with rollover than without rollover. The ratio of AIS 3+
injuries in non-rollover to AIS 3+ injuries in rollovers was 1.38 for
accidents occurring on roads with speed limits of 40-50 mph and 1.47
for accidents occurring on 55-65 mph roads. These statistics suggest
that rollover prevention is roughly equivalent to a 25 percent
reduction in serious injuries for the number of accidents in which
rollovers would be prevented.
Viewing rollover prevention as roughly a 50 percent mitigation of
fatalities and a 25 percent mitigation of serious injuries leads to an
estimate of net benefits resulting from the reduction in harm from
rollover accidents. Net reductions of 3 to 61 serious injuries and 4 to
63 fatalities would be expected for a minimum tilt table angle standard
in the range of 42.8 to 46.4 degrees. Net reductions of 3 to 68 serious
injuries and 2 to 68 fatalities would be expected for a minimum
critical sliding velocity standard in the range studied, i.e., 14.68 to
16.73 kph.
Minimum rollover stability requirements at the levels examined
would have minimal impact on the annual single vehicle accident
rollover fatality toll, because the vehicles affected would be less
than 20 percent of the total light duty vehicle fleet and the vehicles'
stability would only be improved by a marginal amount.
The great majority of rollover fatalities would be unaffected by a
minimum stability standard set at any of these levels, because they
occur in cars, which greatly outnumber light trucks in use, and which,
with few exceptions, have significantly higher rollover stability than
sport utility vehicles, pickup trucks, and vans.
B. Estimate of the Costs of a Standard
As explained above, the agency's analyses predicted a saving of 63
lives for a minimum tilt table angle of 46.4 degrees. This level would
necessitate the modification of an estimated 87 percent of present
compact sport utility vehicles and virtually all present standard vans.
A minimum tilt table angle of 45 degrees, which is higher than the tilt
table angle of 69 percent of present compact sport utility vehicles,
could save 23 lives. Similarly, a minimum critical sliding velocity
standard of 16.73 kph would affect 89 percent of present compact sport
utility vehicles, 38 percent of standard sport utility vehicles, and 38
percent of compact pickups, while saving 68 lives. A critical sliding
velocity minimum standard of 15.91 kph would affect 71 percent of
compact sport utility vehicles and 31 percent of compact pickups, while
saving 34 lives.
Unfortunately, inexpensive vehicle changes, such as offset wheels
or modified tire and rim width combinations, cannot be counted on to
improve stability without producing handling or steering problems. An
increase in track width, derived from frame or suspension alterations,
or a decrease in center of gravity height are the only methods of
improving stability without potential safety liabilities. Such changes
would require large initial costs related to the design and development
of major vehicle components, if not the entire vehicle.
These costs do not take into account the cost of the tests
necessary to determine the tilt table angle or critical sliding
velocity. Because these costs will also be associated with the proposed
consumer information regulation, the testing costs are discussed later
in this notice.
Some of the changes necessary to comply with a minimum standard may
also be incompatible with some of the vehicle characteristics many
consumers seek in vehicles such as sport utility vehicles, vans, motor
homes, and campers. For example, in the case of sport utility vehicles,
the capability to operate in off-road conditions may require both high
ground clearance (necessitating a relatively high center of gravity)
and narrow width to maneuver in wooded or rocky areas (necessitating a
relatively narrow track width). Section 103(f)(3) of the National
Traffic and Motor Vehicle Safety Act provides that a Federal motor
vehicle safety standard must be reasonable and appropriate for each
vehicle type to which it applies, and therefore NHTSA could not mandate
a stability requirement incompatible with certain types of vehicles. In
addition, the manufacturers of many of these types of vehicles would be
considered small businesses, and a standard could raise concerns under
the Regulatory Flexibility Act.
Another possible cost of a minimum rollover standard is decreased
fuel economy. Compact sport utility vehicles have become popular, in
part, because the original sport utility vehicles, which were larger,
heavier, and more stable against rollover, were also more difficult to
park and maneuver and had very poor fuel mileage. The compact sport
utility vehicles with higher stability tend to be the larger vehicles
in the class, or open vehicles with less mass in the top. A stability
standard would be expected to cause a growth in size and weight of
compact sport utility vehicles and a reduction in fuel mileage.
C. Conclusions
Based on these estimates of the benefits and costs of a minimum
stability standard, NHTSA believes that the benefits would not be
sufficient to justify the expected costs. Therefore, as noted above,
NHTSA has decided to defer any further action on this subject until
information becomes available demonstrating the cost effectiveness of
such a rule. The agency may reinitiate such a rulemaking upon receipt
of such information. This termination of rulemaking on vehicle
stability fulfills the statutory mandate of Section 2502(b)(2)(B)(i).
While the agency is terminating rulemaking on a vehicle stability
standard, NHTSA believes that the correlation between stability and
rollover risk is significant enough to justify proposing a consumer
information regulation to relieve the possibility of uninformed risk.
The agency's decision to propose such a regulation is explained below.
VII. Proposed Consumer Information Regulation
A. Rationale
NHTSA is proposing a new consumer information regulation requiring
manufacturers to report the stability metric of cars and light trucks
to enable consumers to make more informed choices concerning the trade-
offs of vehicle attributes and rollover stability. NHTSA believes that
a consumer information regulation would inform drivers of general
differences in stability between light trucks and cars, and among
vehicles in those classes so that consumers can make an informed choice
concerning relative rollover risk. This regulation would inform drivers
who still chose a less stable vehicle that they may wish to drive more
cautiously in certain circumstances and that the higher risk of driving
low stability vehicles can be greatly reduced by using safety belts. In
addition, NHTSA believes that a consumer information regulation would
motivate manufacturers to give more priority to rollover stability in
the design of new vehicles. NHTSA believes these goals can be
accomplished with a minimum burden on industry and consumers.
NHTSA believes that consumer and manufacturer behavior can be
affected through the provision of consumer information. The agency's
experience with the New Car Assessment Program (NCAP) demonstrates the
power of consumer information. Several manufacturers have informed the
agency that they have internal goals of performing well in these 35 mph
frontal crash tests, even though there is no regulatory requirement to
do so. The lowering of the injury scores over time for all
manufacturers, as reported in ``Report on the Historical Performance of
Different Auto Manufacturers in the New Car Assessment Program Tests'',
NHTSA, August 1993, can also be attributed partially to NCAP. The
attention of the media to the program and the more than 20,000 calls
annually to NHTSA's Hotline, the most for any NHTSA consumer
information activity, speak to the consumer's interest in relevant
consumer safety information. As to whether consumers want information
on rollover, recent agency focus groups indicate they would (``Focus
Groups on Traffic Safety Issues: Public Response to NCAP,'' S.W. Morris
& Company, Inc., August 1993, which can be found in Docket No. 79-17,
Notice 01). The consensus of the focus groups was that the agency's
consumer safety information activities should be expanded to include
additional kinds of crashes, including rollover. Consumers also desired
point of sale information, which would be satisfied with the proposed
vehicle sticker requirement.
NHTSA does not agree with those manufacturers who believe that
labeling vehicles with stability information will mislead consumers or
that consumers would consider the metric an absolute measure of the
likelihood of rollover, regardless of driver behavior or roadway
conditions. It has never been shown that improvements in safety or
availability of information regarding safety increase risk-taking. In
addition, the proposed label not only contains the stability
information, it contains the statements: ``All vehicles roll over!
Always wear seat belts! In a rollover crash, an unbelted person is 6 to
9 times more likely to die than a person wearing a seat belt.'' These
statements emphasize to the consumer that a vehicle with a higher
stability rating can still roll over.
NHTSA is considering two possible options for specifying the
stability metric. Under option one, NHTSA would select one of two
metrics, critical sliding velocity or tilt table angle, and require the
metric to be stated for each vehicle. NHTSA requests comments on which
metric is preferable if NHTSA selects only one metric. (Note: The
proposed regulatory text in this notice illustrates this option first
for critical sliding velocity, and then for tilt table angle.) Under
option two, NHTSA would not require a metric to be stated. Instead, the
agency would require vehicles to be labeled with a statement concerning
the rollover stability (e.g., one, two, or three stars) based on
vehicle performance when tested for one or both of the metrics.
B. Proposed Label
NHTSA is proposing to require three types of information on the
label and in owner's manuals. First, manufacturers would be required to
include the stability metric for that vehicle. This information would
either be the same as that reported by the manufacturer to NHTSA (for
option one) or the ``rating'' provided by NHTSA (for option two). This
metric would be required to be reported ``accurate to the nearest
kilometer per hour'' for critical sliding velocity and ``accurate to
the nearest degree'' for tilt table angle. As explained in the
discussion of the two metrics in this notice, NHTSA believes that the
test procedure for both metrics produces results repeatable to this
degree of accuracy. Manufacturers would be allowed to choose which
models and configurations could be grouped together, because they have
the same metric, for the purpose of reporting metrics. However, for
each metric reported by a manufacturer, the manufacturer would have to
fully describe the vehicles to which the metric applies.
Second, the label would be required to contain the metric or rating
ranges provided by NHTSA for both passenger cars and light trucks. The
purpose of this requirement is to emphasize to consumers that there are
significant differences between the stability of the average passenger
car and that of the average truck-based vehicle. This information would
allow consumers to make an informed choice in purchasing a passenger
car or a truck-based vehicle and to compare a vehicle they are
considering to other vehicles in its class.
Third, NHTSA is proposing to require a warning to inform consumers
that all vehicles can, and do, roll over and that the best protection
against injury or fatality, should a rollover occur, is wearing seat
belts.
C. Stability Metrics
As noted above, NHTSA's analyses indicate that there are two
metrics, critical sliding velocity and tilt table angle, which
correlate well with rollover accident data. Either of these metrics
could be used in a stability labeling regulation. Each has its
advantages and disadvantages.
Critical sliding velocity, a dynamic metric, includes the influence
of roll moment of inertia as well as the various static factors
included by the static metrics such as tilt table angle. The advantage
of critical sliding velocity is that it more consistently predicts
rollover risk for light trucks. The disadvantage is that calculation of
critical sliding velocity requires knowledge of the vehicle's center of
gravity height and roll mass moment of inertia. These two parameters
are difficult to measure on complete vehicles and require specialized
equipment to obtain accurate results. However, these parameters can be
measured on vehicle components and manufacturers of complete vehicles
could calculate center of gravity height and roll mass moment of
inertia of complete vehicles from data they have on component
parameters. However, the agency is unsure whether final stage
manufacturers and alterers of specialty vehicles are provided enough
information from incomplete vehicle manufacturers to do this.
Tilt table angle, a static metric, is simple and inexpensive to
measure. The nature of the test is easy for the consumer to understand.
The disadvantage of this metric stems from the statistical relationship
between tilt table angle and accident data. The correlation between
tilt table angle and accident data breaks down if passenger cars are
analyzed separately from light trucks. Further, statistical models
containing tilt table angle data consistently overestimate the rollover
risk for standard vans.
1. Critical Sliding Velocity
Critical sliding velocity, in kilometers per hour, is determined
from the equation:
 where,
 and
I
and
Ixx = roll mass moment of inertia of the vehicle, in kilogram-
kilometers\2\
g = gravitational constant, in kilometers/hour\2\
M = mass of the vehicle, loaded, in kilograms
hcg = center of gravity height of the vehicle, in kilometers
TW = the average of the front and rear track width of the vehicle, in
kilometers.
Calculation of critical sliding velocity requires knowledge of the
vehicle's mass, track width, center of gravity height, and roll moment
of inertia. NHTSA agrees with commenters that the center of gravity
height and roll moment of inertia are complicated measurements. To
address comments on the repeatability of center of gravity height
measurement, NHTSA reviewed two reports.
The study ``Center of Gravity Height: A Round-Robin Measurement
Program,'' sponsored by the Motor Vehicle Manufacturers Association and
conducted by the University of Michigan Transportation Research
Institute (UMTRI-91-4) compared the test facilities, procedures, and
results of center of gravity height measurements at four laboratories.
Each of the four laboratories used different test equipment and
procedures. The study concluded that different measurement procedures
can produce significantly different results. However, the study also
concluded that for each laboratory and test procedure, repeatability
was very good.
Another study, ``Vehicle Inertial Parameters--Measured Values and
Approximations,'' by Garrott et al. (Society of Automotive Engineers
#881767) shows the coefficient of variation of center of gravity height
at the Vehicle Research and Test Center (VRTC) facility to be 0.8
percent. The measurements used in the analyses of the relationship of
critical sliding velocity and single vehicle rollover accidents came
from the VRTC facility.
Based on these studies, NHTSA believes that measurements of center
of gravity height and roll moment of inertia are repeatable within an
individual laboratory using a specified procedure. NHTSA also believes
that these measurements would be repeatable among different
laboratories if all were using the same test procedure. The agency has
data on a group of six make/models of light trucks and one make/model
of car for which tests were run on identical vehicles, or repeated
tests were run on the same vehicle. The results for all of these tests
show the repeatability of critical sliding velocity to be well within
the required accuracy of one kilometer per hour. Therefore, NHTSA
tentatively concludes that the test procedure proposed in this notice
would produce repeatable results. The proposed regulatory text does not
include language for either the test equipment or the test procedure.
The test equipment to be used in the procedure is VTRC's Inertial
Parameter Measuring Device (IPMD). The equipment is described in United
States Patent No. 5,177,998. VRTC is in the process of refining the
test procedure for use with the IPMD, which is described in the report,
``Vehicle Inertial Parameters--Measured Values and Approximations,'' by
Garrott et al. of NHTSA's VRTC. Copies of both the patent and the
report have been placed in Docket No. 91-68, Notice 03.
2. Tilt Table Angle
Some commenters to the ANPRM stated that the tilt table procedure
is not standard practice and its repeatability is not known. Other
commenters stated that the procedure was repeatable.
NHTSA examined two studies which concluded that the tilt table test
is a simple, repeatable method of estimating the static roll stability
of a vehicle. ``Sensitivity Analysis of the Tilt Table Test
Methodology'' is a study sponsored by the Motor Vehicle Manufacturers
Association and conducted by the University of Michigan Transportation
Research Institute (UMTRI-91-48 December 1991). UMTRI found the tilt
table test to be repeatable in their laboratory and found nothing to
prevent site-to-site reproducibility. The other study is a NHTSA study
which found the following parameters to be critical to achieving an
accurate tilt table angle: slow, steady lift rate, minimal platform
deflection, platform angle measurement accurate to 0.1 degree, and
accuracy of measurement of the point at which the last tire leaves the
table (DOT HS 807 747 May 1991).
Based on these studies, NHTSA believes that the tilt table test
would result in repeatable measurements if conducted under specified
conditions. The agency's results for either tests on identical vehicles
or multiple tests on the same vehicle show the repeatability of tilt
table angle to be within the required accuracy of one degree. To ensure
repeatability, NHTSA has included specific test conditions in the tilt
table angle test procedure.
D. Timing of Information Provided by the Manufacturers and NHTSA
By each January 1st, each manufacturer would be required to report
to NHTSA the stability metric for each vehicle to be manufactured on or
after the next September 1 and on or before the first August 31
following that September 1st. Thus, the information for ``1997 model
year'' vehicles (vehicles manufactured between September 1, 1996 and
August 31, 1997) would have to be reported by January 1, 1996. NHTSA
recognizes that not all manufacturers change to production of a new
model year on the same date. If a manufacturer changes production on a
date after September 1, and the difference between model years affects
the stability metric, the manufacturer would have to report a metric
for two ``vehicles'' for a single make/model. NHTSA requests comments
on these proposed dates. NHTSA would consider changing the beginning
and ending date of the annual production period specified in this
regulation if there was a different date that coincides with a majority
of manufacturers' ``model year.''
If option one, which is a quantitative measure based on vehicle
metric calculations, were chosen for a final rule, NHTSA would use the
information provided by the manufacturers to supply manufacturers with
ranges for all passenger cars and light trucks for the upcoming model
year by April 1 of that year (i.e., in the above example, NHTSA would
provide manufacturers ranges for 1997 model year vehicles by April 1,
1996.) If option two were chosen, NHTSA would use the information
provided to provide manufacturers with the ``rating'' which must be
labeled on the vehicle. Since there is a possibility that this
information could not be provided by April 1, the agency requests
comments on how much leadtime manufacturers would need to place the
information on labels and in owner's manuals on all vehicles
manufactured on or after September 1.
NHTSA is proposing to make this new regulation effective on January
1, 1996, based on the presumption that this would give manufacturers at
least one year to complete testing necessary to report the tilt table
angle and/or critical sliding velocity for all vehicles following
publication of a final rule.
E. Benefits
As stated previously, NHTSA anticipates that this consumer
information regulation will result in a more informed public which,
through purchasing and/or driving decisions, could improve motor
vehicle safety. Similarly, consumer purchasing behavior could affect
manufacturers' design and/or marketing of vehicles. The agency is
unable to quantify at this time the benefits of this rulemaking. A more
detailed discussion of the possible benefits of this rulemaking can be
found in the Preliminary Regulatory Evaluation.
F. Costs
The costs associated with the proposed consumer information
regulation would arise from three different activities: generating the
stability metric for the label, printing the labels, and affixing
labels to the vehicles. This rule would not require manufacturers to
make vehicle changes. While such modifications are desirable, they are
not mandated, and if they occurred, would be the indirect result of
market forces and not a direct result of this rulemaking.
As explained in detail in the Preliminary Regulatory Evaluation,
NHTSA estimates that the total testing and labeling costs of a
regulation based on critical sliding velocity would range from $4.71 to
$6.35 million and the total cost of a regulation based on tilt table
angle would range from $3.93 to $5.57 million.
VIII. Final Stage Manufacturers and Alterers
NHTSA requests comments on how final stage manufacturers and
alterers would comply with the proposed consumer information
regulation. Would final stage manufacturers and alterers have
sufficient information on upcoming model year vehicles to report the
tilt table angle and/or critical sliding velocity of the vehicles they
will be producing by January 1 as required? How much information can
incomplete vehicle manufacturers pass on to final stage manufacturers
to assist them in predicting the tilt table angle or critical sliding
velocity of the final vehicle, and when?
NHTSA also asks for comment on how many vehicles in this category
would have a GVWR of 4,536 kilograms or less.
Given that many of these vehicles are manufactured for special
uses, NHTSA requests comments on whether certain types of vehicles
(e.g., walk-in van-type vehicles, campers, and motor homes) should be
excluded from the consumer information requirement. Would consumer
choice for these special-use vehicles be affected by the information
provided by this proposed regulation?
IX. Rulemaking Analyses and Notices
A. Executive Order 12866 and DOT Regulatory Policies and Procedures
NHTSA has examined the impact of this rulemaking action and
determined that it is ``significant'' within the meaning of E.O. 12866
and the Department of Transportation's regulatory policies and
procedures. This rulemaking was reviewed under E.O. 12866. The agency's
detailed analysis of the economic effects can be found in the
Preliminary Regulatory Evaluation available in the docket for this
rulemaking. The agency estimates that the proposed regulation would
cost $3.93 to $6.35 million annually.
B. Regulatory Flexibility Act
NHTSA has also considered the impacts of this notice under the
Regulatory Flexibility Act. I hereby certify that this proposed rule
would not have a significant economic impact on a substantial number of
small entities. As explained above, NHTSA does not expect any
significant economic impacts from this proposed rule. While the agency
has asked questions regarding the availability of data to certain
manufacturers who could be small businesses (final stage manufacturers
and alterers), NHTSA believes that these manufacturers will be able to
obtain sufficient information on the vehicles they complete or alter
that this proposed regulation will not impose a significantly different
burden on these manufacturers.
C. Paperwork Reduction Act
The reporting requirements associated with this proposed rule will
be submitted to the Office of Management and Budget for approval in
accordance with 44 U.S.C. chapter 35. Administration: National Highway
Traffic Safety Administration; Title: Vehicle Rollover Stability
Consumer Information Regulation; Need for Information: To determine
vehicle metric ranges for each model year; Proposed Use of Information:
Metric ranges will be provided to manufacturers for inclusion on
vehicle label; Frequency: Annual; Burden Estimate: 192 hours;
Respondents: 24; Form(s): None; Average Burden Hours for Respondent: 8.
D. National Environmental Policy Act
NHTSA has also analyzed this proposed rule under the National
Environmental Policy Act and determined that it would not have a
significant impact on the human environment.
E. Executive Order 12612 (Federalism)
NHTSA has analyzed this proposal in accordance with the principles
and criteria contained in E.O. 12612, and has determined that this
proposed rule would not have significant federalism implications to
warrant the preparation of a Federalism Assessment.
F. Civil Justice Reform
This proposed rule would not have any retroactive effect. There is
no express statutory intent to preempt any State law. Section 105 of
the Safety Act (15 U.S.C. 1394) sets forth a procedure for judicial
review of final rules. That section does not require submission of a
petition for reconsideration or other administrative proceedings before
parties may file suit in court.
X. Effective Date of Final Rule
If adopted, the proposed amendments would become effective on
January 1, 1996.
XI. Submission of Comments
Interested persons are invited to submit comments on the proposal.
It is requested but not required that 10 copies be submitted.
All comments must not exceed 15 pages in length. (49 CFR 553.21).
Necessary attachments may be appended to these submissions without
regard to the 15-page limit. This limitation is intended to encourage
commenters to detail their primary arguments in a concise fashion.
If a commenter wishes to submit certain information under a claim
of confidentiality, three copies of the complete submission, including
purportedly confidential business information, should be submitted to
the Chief Counsel, NHTSA, at the street address given above, and seven
copies from which the purportedly confidential information has been
deleted should be submitted to the Docket Section. A request for
confidentiality should be accompanied by a cover letter setting forth
the information specified in the agency's confidential business
information regulation. 49 CFR part 512.
All comments received before the close of business on the comment
closing date indicated above for the proposal will be considered, and
will be available for examination in the docket at the above address
both before and after that date. To the extent possible, comments filed
after the closing date will also be considered. Comments received too
late for consideration in regard to the final rule will be considered
as suggestions for further rulemaking action. Comments on the proposal
will be available for inspection in the docket. The NHTSA will continue
to file relevant information as it becomes available in the docket
after the closing date, and it is recommended that interested persons
continue to examine the docket for new material.
Those persons desiring to be notified upon receipt of their
comments in the rules docket should enclose a self-addressed, stamped
postcard in the envelope with their comments. Upon receiving the
comments, the docket supervisor will return the postcard by mail.
List of Subjects in 49 CFR Part 575
Consumer protection, Incorporation by reference, Labeling, Motor
vehicle safety, Motor vehicles.
In consideration of the foregoing, it is proposed that 49 CFR part
575 be amended as follows:
PART 575--CONSUMER INFORMATION REGULATIONS
1. The authority citation for part 575 of title 49 would continue
to read as follows:
Authority: 15 U.S.C. 1392, 1401, 1407, 1421, and 1423;
delegation of authority at 49 CFR 1.50.
2. Part 575 would be amended by adding a new Sec. 575.102 to read
as follows:
Sec. 575.102 Vehicle Rollover Stability.
(a) Purpose and Scope. This section requires motor vehicle
manufacturers to provide information on the resistance of vehicles to
rollover to aid consumers in making an informed choice in the purchase
of new motor vehicles.
(b) Application. This section applies to passenger cars, and to
multipurpose passenger vehicles and trucks with a GVWR of 4,536
kilograms or less, and to manufacturers and dealers of such vehicles.
Alternative One
(c) Definition.--Nearest kilometer per hour means the next lower
whole kilometer per hour, in the case of a calculated critical sliding
velocity value (expressed in kilometers per hour) that falls above a
whole number by 0.00 to 0.49 kilometers per hour, and the next higher
whole kilometer per hour, in the case of a calculated critical sliding
velocity value (expressed in kilometers per hour) that falls above a
whole number by 0.50 to 0.99 kilometers per hour.
Critical Sliding Velocity (CSV) for a vehicle is the value
determined, in kilometers per hour, from the equation:
 where,
 and
I
and
Ixx=roll mass moment of inertia of the vehicle, in kilogram-
kilometers2
g=gravitational constant, in kilometers/hour2
M=mass of the vehicle, loaded, in kilograms
hcg=center of gravity height of the vehicle, in kilometers
TW=the average of the front and rear track width of the vehicle, in
kilometers.
Production year means the period from September 1 of a calendar
year to August 31 of the next calendar year, inclusive.
Vehicle means a group of vehicles within a make, model, or car
division which have a degree of commonality in construction (e.g.,
body, chassis). It does not consider any level of decor, opulence, or
other characteristics that do not affect CSV.
(d) Reporting Requirements--(1) Reporting. On or before January 1
of each calendar year, beginning with the 1996 calendar year, each
manufacturer shall report to the Administrator a CSV for each vehicle
to be manufactured in the production year beginning on September 1 of
that calendar year. The CSV shall be accurate to the nearest kilometer
per hour. In reporting a CSV, the manufacturer shall list the
vehicle(s) to which it applies.
(2) Information. On or before April 1 of each calendar year,
beginning with the 1996 calendar year, the Administrator, based on the
information provided by all manufacturers under paragraph (d)(1) of
this section, provides manufacturers with the passenger car and
multipurpose passenger vehicle/truck CSV ranges to appear on the
vehicle label and in the owner's manual under paragraphs (e)(1)(i)
through (e)(1)(iii) of this section.
(e) Label--(1) Attachment and Maintenance of Label. (i) Each
vehicle manufactured on or after September 1, 1996 shall have affixed
to it a vehicle rollover stability label as described in paragraph
(e)(3) of this section. Each manufacturer shall affix or cause to be
affixed the labels required by this paragraph at the final assembly
point.
(ii) Each dealer shall maintain or cause to be maintained, any
vehicle rollover stability label on the vehicles it receives until the
vehicles are sold to consumers for purposes other than resale. If a
label becomes damaged so that any of the information on it is not
legible, the dealer shall replace it by affixing an identical,
undamaged label.
(iii) Each vehicle required by paragraph (e)(1)(i) of this section
to have a vehicle rollover stability label shall have in the vehicle
owner's manual the same information required to be on the label under
paragraphs (e)(3)(i) through (e)(3)(vii) of this section.
(2) Location of Label. (i) The label required by paragraph
(e)(1)(i) of this section shall be affixed on a side window of the
vehicle in a manner so that it can be read from outside the vehicle.
(ii) The label shall be either a separate label, a part of the
price information label required by 15 U.S.C. Sec. 1232, or a part of
the fuel economy label required by 15 U.S.C. Sec. 2006. If the rollover
stability label is separate and the window is not large enough to
contain both the price information label and the rollover stability
label, it shall be affixed on a side window, as close as possible to
the price information label.
(3) Label Requirements. (i) Each rollover stability label shall be
rectangular, not less than 114 mm high by 178 mm wide, and shall be in
the exact format shown in Figure 1. Each label shall bear the exact
wording shown in Figure 1. The CSV in the circle shall be the CSV
reported to the Administrator pursuant to paragraph (d)(1) of this
section for the labeled vehicle and the square brackets shall be
replaced by CSV range data given to the vehicle manufacturer by the
Administrator pursuant to paragraph (d)(2) of this section for the
production year of the labeled vehicle.
BILLING CODE 4910-59-P
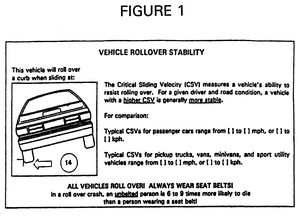 BILLING CODE 4910-59-C
(ii) The color of the label picture and text shall contrast with
the background of the label.
(iii) All rollover stability information on the label shall be
completely surrounded by a border at least 3 mm wide which contrasts
with the background of the label.
(iv) The title, ``Vehicle Rollover Stability,'' shall be centered
over the label and shall be printed in bold caps no smaller than 12
points.
(v) The remainder of the label text shall be 10 points.
(vi) The illustration of the vehicle in Figure 1 shall be centered
in a square not less than 50 mm on each side. The inside diameter of
the circle in which the CSV appears shall be no smaller than 16 mm. The
CSV figure shall be centered in the circle and no smaller than 10 mm in
height.
(f) Test Conditions--(1) Test Device. Measurement of center of
gravity height and roll moment of inertia are done on the Inertial
Parameter Measuring Device (IPMD). The IPMD is described in United
States Patent No. 5,177,998. A copy of the patent is available in
Docket No. 91-68, Notice 03.
(2) Vehicle--(i) The test vehicle has all fluids, other than fuel,
at the full level. The fuel tank and the fuel system are filled as
specified in S7.1.1 and S7.1.2 of Sec. 571.301 of this title.
(ii) The vehicle's seat is positioned according to S8.1.2 and
S8.1.3 of Sec. 571.208 of this title.
(iii) Tires used during the test are of the same size and
construction recommended by the manufacturer for the vehicle. The tires
have accumulated not less than 80 and not more than 1620 kilometers.
Not less than 80 of those kilometers are accumulated at a speed of not
less than 80 kilometers per hour. All tires are clean and dry. All
tires are inflated to the vehicle manufacturer's recommended inflation
pressure for maximum vehicle loading and measured when the tire is
cold.
(iv) All vehicle openings (doors, windows, hood, trunk, convertible
top, etc) are in the closed position.
(3) Load. A Hybrid III Test Dummy, as defined in Subpart E of
Sec. 572 of this title, is placed in the left front seating position,
positioned according to S11 of Sec. 571.208 of this title, and secured
with the vehicle's safety belt system, whether manual or automatic. The
dummy may be placed in the test vehicle before or after moving the
vehicle onto the test device. The test vehicle carries no load other
than the test dummy.
(4) Ambient conditions. The measurements of the center of gravity
height and roll mass moment of inertia are made with both the vehicle
and the test device at a temperature not less than 4 and not more than
39 degrees Celsius. Air motion around the vehicle and device is less
than 6 kilometers per hour.
(g) Test Procedures. The test procedure for use with the IPMD is
described in the report, ``Vehicle Inertial Parameters--Measured Values
and Approximations,'' by Garrott et al. of NHTSA's VRTC. A copy of the
report is available in Docket No. 91-68, Notice 03.
Alternative Two
(c) Definitions--Nearest degree means the next lower whole degree,
in the case of a measurement that falls above a whole number by 0.00 to
0.49 degrees, and the next higher whole degree, in the case of a
measurement that falls above a whole number by 0.50 to 0.99.
Production year means the period from September 1 of a calendar
year to August 31 of the next calendar year, inclusive.
Tilt table angle (TTA) means, with respect to a motor vehicle
placed on a tilt table, the angle between the horizontal and the
platform of the tilt table when the last uphill tire of the vehicle
ceases contact with the platform surface.
Vehicle means a group of vehicles within a make, model, or car
division which have a degree of commonality in construction (e.g.,
body, chassis). It does not consider any level of decor, opulence, or
other characteristics that do not affect TTA.
(d) Reporting Requirements--(1) Reporting. On or before January 1
of each calendar year, beginning with the 1996 calendar year, each
manufacturer shall report to the Administrator a TTA for each vehicle
to be manufactured in the production year beginning on September 1 of
that calendar year. The TTA shall be accurate to the nearest degree. In
reporting a TTA, the manufacturer shall list the vehicle(s) to which it
applies.
(2) Information. On or before April 1 of each calendar year,
beginning with the 1996 calendar year, the Administrator, based on the
information provided by all manufacturers under paragraph (d)(1) of
this section, provides manufacturers with the passenger car and
multipurpose passenger vehicle/truck TTA ranges to appear on the
vehicle label and in the owner's manual under paragraphs (e)(1)(i)
through (e)(1)(iii) of this section.
(e) Label--(1) Attachment and Maintenance of Label. (i) Each
vehicle manufactured on or after September 1, 1996 shall have affixed
to it a vehicle rollover stability label as described in paragraph
(e)(3) of this section. Each manufacturer shall affix or cause to be
affixed the labels required by this paragraph at the final assembly
point.
(ii) Each dealer shall maintain or cause to be maintained, any
vehicle rollover stability label on the vehicles it receives until the
vehicles are sold to consumers for purposes other than resale. If a
label becomes damaged so that any of the information on it is not
legible, the dealer shall replace it by affixing an identical,
undamaged label.
(iii) Each vehicle required by paragraph (e)(1)(i) of this section
to have a vehicle rollover stability label shall have in the vehicle
owner's manual the same information required to be on the label under
paragraphs (e)(3)(i) through (e)(3)(vii) of this section.
(2) Location of Label. (i) The label required by paragraph
(e)(1)(i) of this section shall be affixed on a side window of the
vehicle in a manner so that it can be read from outside the vehicle.
(ii) The label shall be either a separate label, a part of the
price information label required by 15 U.S.C. Sec. 1232, or a part of
the fuel economy label required by 15 U.S.C. Sec. 2006. If the rollover
stability label is separate and the window is not large enough to
contain both the price information label and the rollover stability
label, it shall be affixed on a side window, as close as possible to
the price information label.
(3) Label Requirements. (i) Each rollover stability label shall be
rectangular, not less than 114 mm high by 178 mm wide, and shall be in
the exact format shown in Figure 2. Each label shall bear the exact
wording shown in Figure 2. The TTA in the circle shall be the TTA
reported to the Administrator pursuant to paragraph (d)(1) of this
section for the labeled vehicle and the square brackets shall be
replaced by TTA range data given to the vehicle manufacturer by the
Administrator pursuant to paragraph (d)(2) of this section for the
production year of the labeled vehicle.
(ii) The color of the label picture and text shall contrast with
the background of the label.
(iii) All rollover stability information on the label shall be
completely surrounded by a border at least 3 mm wide which contrasts
with the background of the label.
(iv) The title, ``Vehicle Rollover Stability,'' shall be centered
over the label and shall be printed in bold caps no smaller than 12
points.
(v) The remainder of the label text shall be 10 points.
(vi) The illustration of the vehicle in Figure 2 shall be centered
in a square not less than 50 mm on each side. The inside diameter of
the circle in which the TTA appears shall be no smaller than 16 mm. The
TTA figure shall be centered in the circle and no smaller than 10 mm in
height.
(f) Test Conditions--(1) Tilt table. (i) The tilt table has a rigid
platform or platforms onto which a test vehicle can be rolled.
BILLING CODE 4910-59-P
BILLING CODE 4910-59-C
(ii) The color of the label picture and text shall contrast with
the background of the label.
(iii) All rollover stability information on the label shall be
completely surrounded by a border at least 3 mm wide which contrasts
with the background of the label.
(iv) The title, ``Vehicle Rollover Stability,'' shall be centered
over the label and shall be printed in bold caps no smaller than 12
points.
(v) The remainder of the label text shall be 10 points.
(vi) The illustration of the vehicle in Figure 1 shall be centered
in a square not less than 50 mm on each side. The inside diameter of
the circle in which the CSV appears shall be no smaller than 16 mm. The
CSV figure shall be centered in the circle and no smaller than 10 mm in
height.
(f) Test Conditions--(1) Test Device. Measurement of center of
gravity height and roll moment of inertia are done on the Inertial
Parameter Measuring Device (IPMD). The IPMD is described in United
States Patent No. 5,177,998. A copy of the patent is available in
Docket No. 91-68, Notice 03.
(2) Vehicle--(i) The test vehicle has all fluids, other than fuel,
at the full level. The fuel tank and the fuel system are filled as
specified in S7.1.1 and S7.1.2 of Sec. 571.301 of this title.
(ii) The vehicle's seat is positioned according to S8.1.2 and
S8.1.3 of Sec. 571.208 of this title.
(iii) Tires used during the test are of the same size and
construction recommended by the manufacturer for the vehicle. The tires
have accumulated not less than 80 and not more than 1620 kilometers.
Not less than 80 of those kilometers are accumulated at a speed of not
less than 80 kilometers per hour. All tires are clean and dry. All
tires are inflated to the vehicle manufacturer's recommended inflation
pressure for maximum vehicle loading and measured when the tire is
cold.
(iv) All vehicle openings (doors, windows, hood, trunk, convertible
top, etc) are in the closed position.
(3) Load. A Hybrid III Test Dummy, as defined in Subpart E of
Sec. 572 of this title, is placed in the left front seating position,
positioned according to S11 of Sec. 571.208 of this title, and secured
with the vehicle's safety belt system, whether manual or automatic. The
dummy may be placed in the test vehicle before or after moving the
vehicle onto the test device. The test vehicle carries no load other
than the test dummy.
(4) Ambient conditions. The measurements of the center of gravity
height and roll mass moment of inertia are made with both the vehicle
and the test device at a temperature not less than 4 and not more than
39 degrees Celsius. Air motion around the vehicle and device is less
than 6 kilometers per hour.
(g) Test Procedures. The test procedure for use with the IPMD is
described in the report, ``Vehicle Inertial Parameters--Measured Values
and Approximations,'' by Garrott et al. of NHTSA's VRTC. A copy of the
report is available in Docket No. 91-68, Notice 03.
Alternative Two
(c) Definitions--Nearest degree means the next lower whole degree,
in the case of a measurement that falls above a whole number by 0.00 to
0.49 degrees, and the next higher whole degree, in the case of a
measurement that falls above a whole number by 0.50 to 0.99.
Production year means the period from September 1 of a calendar
year to August 31 of the next calendar year, inclusive.
Tilt table angle (TTA) means, with respect to a motor vehicle
placed on a tilt table, the angle between the horizontal and the
platform of the tilt table when the last uphill tire of the vehicle
ceases contact with the platform surface.
Vehicle means a group of vehicles within a make, model, or car
division which have a degree of commonality in construction (e.g.,
body, chassis). It does not consider any level of decor, opulence, or
other characteristics that do not affect TTA.
(d) Reporting Requirements--(1) Reporting. On or before January 1
of each calendar year, beginning with the 1996 calendar year, each
manufacturer shall report to the Administrator a TTA for each vehicle
to be manufactured in the production year beginning on September 1 of
that calendar year. The TTA shall be accurate to the nearest degree. In
reporting a TTA, the manufacturer shall list the vehicle(s) to which it
applies.
(2) Information. On or before April 1 of each calendar year,
beginning with the 1996 calendar year, the Administrator, based on the
information provided by all manufacturers under paragraph (d)(1) of
this section, provides manufacturers with the passenger car and
multipurpose passenger vehicle/truck TTA ranges to appear on the
vehicle label and in the owner's manual under paragraphs (e)(1)(i)
through (e)(1)(iii) of this section.
(e) Label--(1) Attachment and Maintenance of Label. (i) Each
vehicle manufactured on or after September 1, 1996 shall have affixed
to it a vehicle rollover stability label as described in paragraph
(e)(3) of this section. Each manufacturer shall affix or cause to be
affixed the labels required by this paragraph at the final assembly
point.
(ii) Each dealer shall maintain or cause to be maintained, any
vehicle rollover stability label on the vehicles it receives until the
vehicles are sold to consumers for purposes other than resale. If a
label becomes damaged so that any of the information on it is not
legible, the dealer shall replace it by affixing an identical,
undamaged label.
(iii) Each vehicle required by paragraph (e)(1)(i) of this section
to have a vehicle rollover stability label shall have in the vehicle
owner's manual the same information required to be on the label under
paragraphs (e)(3)(i) through (e)(3)(vii) of this section.
(2) Location of Label. (i) The label required by paragraph
(e)(1)(i) of this section shall be affixed on a side window of the
vehicle in a manner so that it can be read from outside the vehicle.
(ii) The label shall be either a separate label, a part of the
price information label required by 15 U.S.C. Sec. 1232, or a part of
the fuel economy label required by 15 U.S.C. Sec. 2006. If the rollover
stability label is separate and the window is not large enough to
contain both the price information label and the rollover stability
label, it shall be affixed on a side window, as close as possible to
the price information label.
(3) Label Requirements. (i) Each rollover stability label shall be
rectangular, not less than 114 mm high by 178 mm wide, and shall be in
the exact format shown in Figure 2. Each label shall bear the exact
wording shown in Figure 2. The TTA in the circle shall be the TTA
reported to the Administrator pursuant to paragraph (d)(1) of this
section for the labeled vehicle and the square brackets shall be
replaced by TTA range data given to the vehicle manufacturer by the
Administrator pursuant to paragraph (d)(2) of this section for the
production year of the labeled vehicle.
(ii) The color of the label picture and text shall contrast with
the background of the label.
(iii) All rollover stability information on the label shall be
completely surrounded by a border at least 3 mm wide which contrasts
with the background of the label.
(iv) The title, ``Vehicle Rollover Stability,'' shall be centered
over the label and shall be printed in bold caps no smaller than 12
points.
(v) The remainder of the label text shall be 10 points.
(vi) The illustration of the vehicle in Figure 2 shall be centered
in a square not less than 50 mm on each side. The inside diameter of
the circle in which the TTA appears shall be no smaller than 16 mm. The
TTA figure shall be centered in the circle and no smaller than 10 mm in
height.
(f) Test Conditions--(1) Tilt table. (i) The tilt table has a rigid
platform or platforms onto which a test vehicle can be rolled.
BILLING CODE 4910-59-P
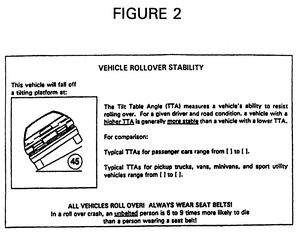 BILLING CODE 4910-59-C
(ii) The surfaces of the areas on the platform(s) where the tires
of the test vehicle rest are in the same plane at all times during the
test.
(iii) The surface of each tire contact area is smooth, cold rolled
finished, unpainted steel. The surface of the platform(s) is dry and
free of corrosion.
(iv) The table is able to rotate about a longitudinal axis not less
than 50 degrees from the horizontal position.
(v) The axes of rotation are horizontal and parallel to one of the
sides of the tilt table platform(s). If rotation is accomplished via
hinges, all of the hinge axes of rotation are collinear.
(vi) The rate of rotation is constant and does not exceed 0.25
degree per second.
(vii) The tilt table platform has a 2.5 centimeter high trip rail
for each of the vehicle's axles. Each trip rail is parallel to the axis
of rotation of the table and is able to move perpendicular to the axis
of rotation. The length of each trip rail is equal to or greater than
the diameter of the tire on the vehicle to be tested. The trip rail
surface facing the tire is parallel to the axis of rotation of the
table and perpendicular to the table surface. The trip rail does not
move during a test.
(viii) If the tilt table has a vehicle restraint system to prevent
the test vehicle from falling off the platform during a test, the
restraint system shall allow all tires on the uphill side of the test
vehicle to lift at least 0.33 meter off the platform(s). The portion of
the restraint system supported by the test vehicle when the uphill
tires have lifted off the platform(s) shall weigh no more than 6.75
kilograms.
(ix) The tilt table instrumentation consists of means to measure
the angle of the platform(s) from the horizontal and one contact switch
under each of the uphill side tires to indicate when each tire has
lifted off its platform surface contact area.
(2) Vehicle. (i) The test vehicle has all fluids, other than fuel,
at the full level. The fuel tank and the fuel system are filled as
specified in S7.1.1 and S7.1.2 of Sec. 571.301 of this title.
(ii) The vehicle's seat is positioned according to S8.1.2 and
S8.1.3 of Sec. 571.208 of this title.
(iii) Tires used during the test are of the same size and
construction recommended by the manufacturer for the vehicle. The tires
have accumulated not less than 80 and not more than 1620 kilometers.
Not less than 80 of those kilometers are accumulated at a speed of not
less than 80 kilometers per hour. All tires are clean and dry. All
tires are inflated to the vehicle tire manufacturer's recommended
inflation pressure for maximum vehicle loading and measured when the
tire is cold.
(iv) All vehicle openings (doors, windows, hood, trunk, convertible
top, etc) are in the closed position.
(3) Load. A Hybrid III Test Dummy, as defined in Subpart E of
Sec. 572 of this title, is placed in the left front seating position,
positioned according to S11 of Sec. 571.208 of this title, and secured
with the vehicle's safety belt system, whether manual or automatic. The
dummy may be placed in the test vehicle before or after moving the
vehicle on to the tilt table. The test vehicle carries no load other
than the test dummy.
(4) Ambient conditions. The tilt table test is conducted with both
the vehicle and the tilt table at a temperature not less than 4 and not
more than 39 degrees Celsius. Air motion around the vehicle and tilt
table is less than 6 kilometers per hour.
(g) Test Procedure--(1) Vehicle Positioning. (i) The test vehicle
is positioned on the tilt table such that the vehicle's longitudinal
axis is parallel to the axis of rotation of the table and the left side
of the vehicle is positioned such that the driver's side of the vehicle
will be on the low side when the table is tilted. The wheels are
parallel to the vehicle's longitudinal axis.
(ii) After the vehicle has been positioned in accordance with
paragraph (g)(1)(i) of this section, the engine is turned off. For
automatic transmission vehicles, the transmission is in Park or, if the
vehicle does not have a Park position, the transmission is placed in
the Neutral position and the parking brake applied such that the
vehicle does not roll during the test. For manual transmission
vehicles, the transmission is in first gear and the parking brake is
applied such that the vehicle does not roll during the test.
(iii) The front trip rail is moved until it is just touching the
driver's side front tire of the test vehicle, then locked in place. The
rear trip rail is moved until it is just touching the driver's side
rear tire of the test vehicle, then locked in place.
(2) Testing. (i) Each tilt table test consists of six tilts. The
positioning of the test vehicle on the tilt table and the contents of
the vehicle are not adjusted between tilts.
(ii) For each tilt, the platform is rotated from the horizontal
until all of the uphill tires on the test vehicle have lifted off the
platform, as indicated by the contact switches under the uphill tires.
(iii) The platform angle at which the last tire lifts off the
platform is the TTA of the vehicle for that tilt. The vehicle shall
then be returned to the horizontal position at a rate not to exceed
0.25 degrees per second.
(iv) The lowest TTA of the last three tilts in the six-tilt series
is the TTA for the tested vehicle.
Issued on June 23, 1994.
Barry Felrice,
Associate Administrator for Rulemaking.
[FR Doc. 94-15598 Filed 6-23-94; 11:51 am]
BILLING CODE 4910-59-P
[Federal Register Volume 59, Number 142 (Tuesday, July 26, 1994)]
[Unknown Section]
[Page 0]
From the Federal Register Online via the Government Publishing Office [www.gpo.gov]
[FR Doc No: X94-20726]
[[Page Unknown]]
[Federal Register: July 26, 1994]
VOL. 59, NO. 142
Tuesday, July 26, 1994
DEPARTMENT OF TRANSPORTATION
National Highway Traffic Safety Administration
49 CFR Part 575
[Docket No. 91-68; Notice 03]
RIN 2127-AC64
Consumer Information Regulations; Federal Motor Vehicle Safety
standards; Rollover Prevention
Correction
In proposed rule document 94-15598 beginning on page 33254 in the
issue of Tuesday, June 28, 1994, make the following corrections:
1. On page 33264, in the third column, under ``1. Critical Sliding
Velocity,'' the first equation appearing in the first paragraph is
corrected to read as follows:
TN26JY94.006
Sec. 575.102 [Corrected]
2. On page 33267, in the second column, in paragraph (c), the first
equation appearing in the paragraph defining ``Critical Sliding
Velocity'' is corrected to read as follows:
TN26JY94.007
BILLING CODE 1505-01-D
BILLING CODE 4910-59-C
(ii) The surfaces of the areas on the platform(s) where the tires
of the test vehicle rest are in the same plane at all times during the
test.
(iii) The surface of each tire contact area is smooth, cold rolled
finished, unpainted steel. The surface of the platform(s) is dry and
free of corrosion.
(iv) The table is able to rotate about a longitudinal axis not less
than 50 degrees from the horizontal position.
(v) The axes of rotation are horizontal and parallel to one of the
sides of the tilt table platform(s). If rotation is accomplished via
hinges, all of the hinge axes of rotation are collinear.
(vi) The rate of rotation is constant and does not exceed 0.25
degree per second.
(vii) The tilt table platform has a 2.5 centimeter high trip rail
for each of the vehicle's axles. Each trip rail is parallel to the axis
of rotation of the table and is able to move perpendicular to the axis
of rotation. The length of each trip rail is equal to or greater than
the diameter of the tire on the vehicle to be tested. The trip rail
surface facing the tire is parallel to the axis of rotation of the
table and perpendicular to the table surface. The trip rail does not
move during a test.
(viii) If the tilt table has a vehicle restraint system to prevent
the test vehicle from falling off the platform during a test, the
restraint system shall allow all tires on the uphill side of the test
vehicle to lift at least 0.33 meter off the platform(s). The portion of
the restraint system supported by the test vehicle when the uphill
tires have lifted off the platform(s) shall weigh no more than 6.75
kilograms.
(ix) The tilt table instrumentation consists of means to measure
the angle of the platform(s) from the horizontal and one contact switch
under each of the uphill side tires to indicate when each tire has
lifted off its platform surface contact area.
(2) Vehicle. (i) The test vehicle has all fluids, other than fuel,
at the full level. The fuel tank and the fuel system are filled as
specified in S7.1.1 and S7.1.2 of Sec. 571.301 of this title.
(ii) The vehicle's seat is positioned according to S8.1.2 and
S8.1.3 of Sec. 571.208 of this title.
(iii) Tires used during the test are of the same size and
construction recommended by the manufacturer for the vehicle. The tires
have accumulated not less than 80 and not more than 1620 kilometers.
Not less than 80 of those kilometers are accumulated at a speed of not
less than 80 kilometers per hour. All tires are clean and dry. All
tires are inflated to the vehicle tire manufacturer's recommended
inflation pressure for maximum vehicle loading and measured when the
tire is cold.
(iv) All vehicle openings (doors, windows, hood, trunk, convertible
top, etc) are in the closed position.
(3) Load. A Hybrid III Test Dummy, as defined in Subpart E of
Sec. 572 of this title, is placed in the left front seating position,
positioned according to S11 of Sec. 571.208 of this title, and secured
with the vehicle's safety belt system, whether manual or automatic. The
dummy may be placed in the test vehicle before or after moving the
vehicle on to the tilt table. The test vehicle carries no load other
than the test dummy.
(4) Ambient conditions. The tilt table test is conducted with both
the vehicle and the tilt table at a temperature not less than 4 and not
more than 39 degrees Celsius. Air motion around the vehicle and tilt
table is less than 6 kilometers per hour.
(g) Test Procedure--(1) Vehicle Positioning. (i) The test vehicle
is positioned on the tilt table such that the vehicle's longitudinal
axis is parallel to the axis of rotation of the table and the left side
of the vehicle is positioned such that the driver's side of the vehicle
will be on the low side when the table is tilted. The wheels are
parallel to the vehicle's longitudinal axis.
(ii) After the vehicle has been positioned in accordance with
paragraph (g)(1)(i) of this section, the engine is turned off. For
automatic transmission vehicles, the transmission is in Park or, if the
vehicle does not have a Park position, the transmission is placed in
the Neutral position and the parking brake applied such that the
vehicle does not roll during the test. For manual transmission
vehicles, the transmission is in first gear and the parking brake is
applied such that the vehicle does not roll during the test.
(iii) The front trip rail is moved until it is just touching the
driver's side front tire of the test vehicle, then locked in place. The
rear trip rail is moved until it is just touching the driver's side
rear tire of the test vehicle, then locked in place.
(2) Testing. (i) Each tilt table test consists of six tilts. The
positioning of the test vehicle on the tilt table and the contents of
the vehicle are not adjusted between tilts.
(ii) For each tilt, the platform is rotated from the horizontal
until all of the uphill tires on the test vehicle have lifted off the
platform, as indicated by the contact switches under the uphill tires.
(iii) The platform angle at which the last tire lifts off the
platform is the TTA of the vehicle for that tilt. The vehicle shall
then be returned to the horizontal position at a rate not to exceed
0.25 degrees per second.
(iv) The lowest TTA of the last three tilts in the six-tilt series
is the TTA for the tested vehicle.
Issued on June 23, 1994.
Barry Felrice,
Associate Administrator for Rulemaking.
[FR Doc. 94-15598 Filed 6-23-94; 11:51 am]
BILLING CODE 4910-59-P
[Federal Register Volume 59, Number 142 (Tuesday, July 26, 1994)]
[Unknown Section]
[Page 0]
From the Federal Register Online via the Government Publishing Office [www.gpo.gov]
[FR Doc No: X94-20726]
[[Page Unknown]]
[Federal Register: July 26, 1994]
VOL. 59, NO. 142
Tuesday, July 26, 1994
DEPARTMENT OF TRANSPORTATION
National Highway Traffic Safety Administration
49 CFR Part 575
[Docket No. 91-68; Notice 03]
RIN 2127-AC64
Consumer Information Regulations; Federal Motor Vehicle Safety
standards; Rollover Prevention
Correction
In proposed rule document 94-15598 beginning on page 33254 in the
issue of Tuesday, June 28, 1994, make the following corrections:
1. On page 33264, in the third column, under ``1. Critical Sliding
Velocity,'' the first equation appearing in the first paragraph is
corrected to read as follows:
TN26JY94.006
Sec. 575.102 [Corrected]
2. On page 33267, in the second column, in paragraph (c), the first
equation appearing in the paragraph defining ``Critical Sliding
Velocity'' is corrected to read as follows:
TN26JY94.007
BILLING CODE 1505-01-D